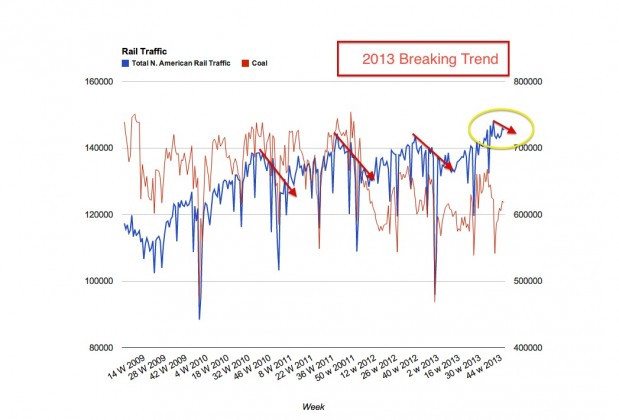
Rail traffic is bucking its historic trend and that, should it continue a few more weeks is VERY good news as we head into 2014…
Typically we see rail traffic peak for the year around weeks 37-39 and then begin a pretty steady decline through the remainder of the year. We aren’t seeing that yet in 2013. What we are seeing (the arrows on the chart below) is instead of a pronounced decline, we are seeing a very gradual, almost a flattening of rail traffic. What is particularly encouraging is that this flattening is happening at the high levels of not only this year but the last 4 years (since I began this chart). The strength is coming from metal, autos, forrest products and intermodal. All are indicative of continued manufacturing activity strength.
I said a few weeks ago when we last looked at this that I thought the data was stronger that what it typically is and that was encouraging but that we would have to wait a few weeks to see if this was a one off event or something more. It appears now to be something more. Unless rail traffic collapses the next few weeks, this is very bullish news for the general economy.
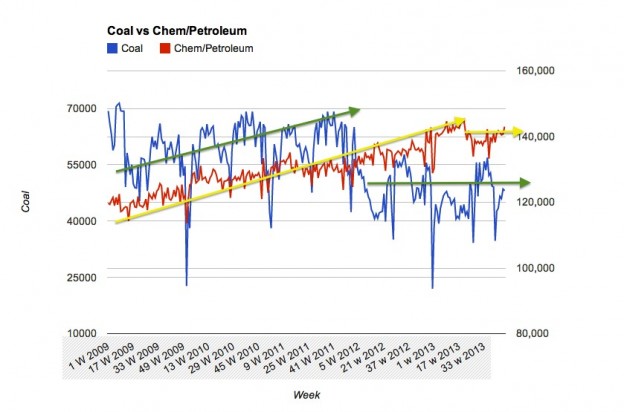
Now, the naysayers will again claim that it is oil traffic that is boosting the numbers. A look below refutes that. Previous years saw steadily increasing demand from both oil and coal even as rail shipments as whole fell precipitously from week 37-39 on (normal). In 2013 coal has essentially flatlined and “petroleum/chemical” shipments have remained flat for most of the year. Rather than casting doubt on the above data, this tells us that the underlying strength is even greater that what the above chart indicates as these two categories, normally positive contributors to rail traffic this time of the year aren’t really doing anything now.

