We have some very contradictory numbers out there… makes me wonder which one isn’t accurate
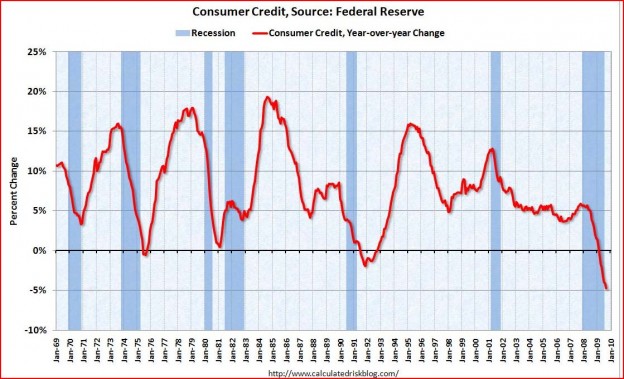
So first we have what we all already know. Consumer credit is being pinched off. Visually, here it is
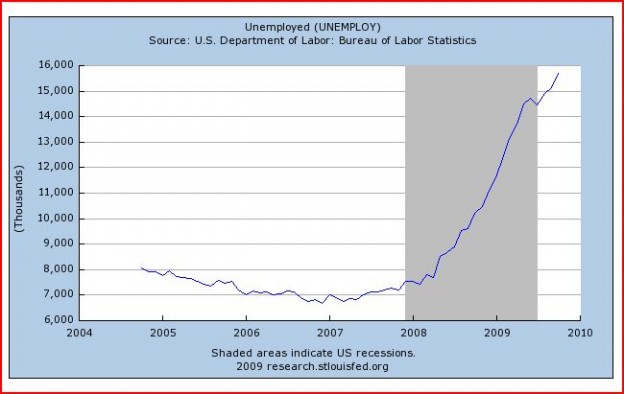
We have consumer credit shrinking at a rate not seen in most people lifetime. We also have unemployment surging as witness here:
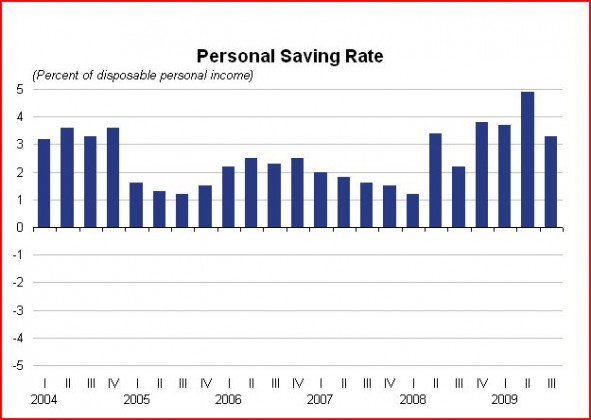
So, if we have more people out of work daily and less credit on a daily basis with more savings, can anyone explain how this graph is possible?
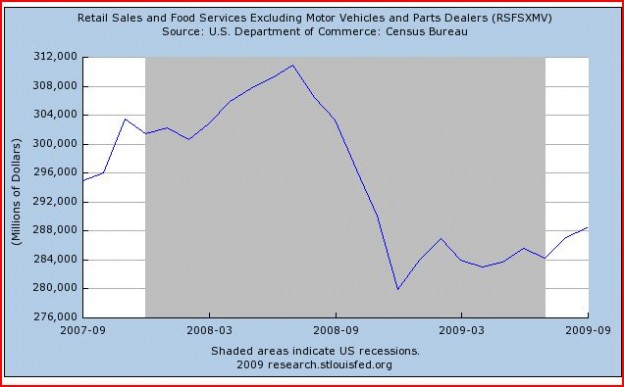
How can we be seeing a rise in retail sales (the chart is ex autos to take out the “cash for clunkers” effect). Yes, I know retail dropped like a stone last year but if we look at the unemployment and retail graph together:
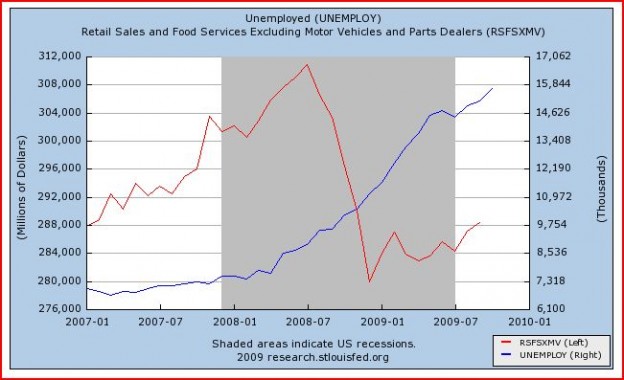
This seems to run contrary to what we would think. Now one reason could be that retail sales last year fell below a basic level. That may be true but that basic level is falling as unemployment continues to rise and credit shrinks. We should not be seeing a retail sales numbers and results from the Gap (GPS) that run contrary to unemployment/credit. While unemployed folks need food and will put a basic demand level under that area, they do not need designer clothes from Gap (GPS) (or 0thers). We should not be seeing surprising upside sales results here given the above numbers.
Unless…
What if the unemployment number is not what it seems? We are always hearing how the “real rate” of unemployment is far higher than the reported numbers because of those who have “given up” and are no longer working. But, what if it really isn’t? How many of us work and receive 1099’s. How many of us know whole departments of people who have been “laid off” and were rehired on a 1099 status? These workers, if they filed unemployment would still be being counted in unemployment numbers or assumed to have “given up”. What if scores of these folks who are presumed to have “given up” are instead working as 1099 workers?
Now, of course all this is guesswork from empirical data as the exact number of 1099 workers is not available (some people get several 1099’s for different work). But, I am wondering how consumer credit can fall (people are not running up charge accounts), savings can be at decade highs and “real unemployment” can be in the 15%-20% range it is said to be yet we can have retail sales on a steady rise.
If I had told you the above savings,credit and unemployment numbers were the current scenario out there and asked you to predict the direction of retail sales, I would find it hard to believe you would guess anywhere but down. Yet that is not the reality.
Can anyone provide 1099 numbers?
It just doesn’t add up..
