Be careful of the interpretation of this data around the web….
Those with a negative view will harp on the “rate of growth falling” as a sign things are falling apart. While true the rate of growth has slowed , it is also true that this is a common occurrence this time of year as the following chart indicates (note “baseline” and “cyclical” lines)
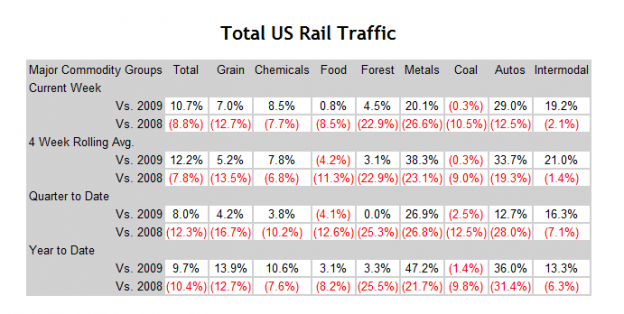
Here is the hard data (click to enlarge)
So yes, recent growth is below the 4 week rolling average but it is still growth. It is also true that we typically see traffic dip into Q3. Again, while the rate of growth has slowed, the last three weeks have seen total rail car volume of 580,838, 647,975 & 655,971 cars….slowing increasing. It should also be noted that the 655k cars last week were the second highest total this year (659k in weeks 23 & 24). Further, this is total N. American traffic, including Canada and Mexico. While Canada is holding essentially flat, Mexican traffic has fallen ~40% during weeks 27 & 28 from prior weeks.
From that we can deduce that if total carloads the last three weeks have climbed, Canada has remained flat and Mexico has fallen, we are seeing considerable strength in the US rail system.
This is confirmed by the chart above that shows last weeks traffic showing considerable improvement almost across the board over the month to date numbers and inline with year to date numbers.
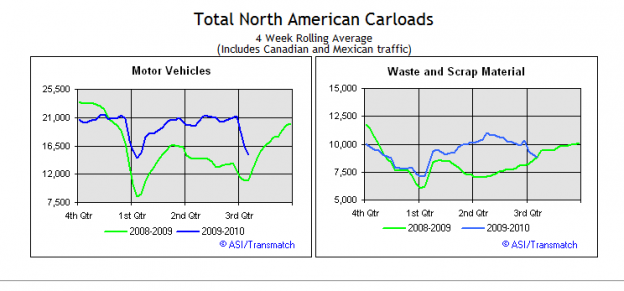
Those inclined to have a negative view will then point to the following charts:

Again looking at the data, we see seasonal weakness heading into Q1 and Q3 annually. That being said, the chart is a 4 week rolling average. If we drill down, we see after weakness in weeks 27 & 28 in which carloads fell from 19k in week 26 to 12k & 11K respectively in 27 & 28, they rebounded to just under 17k last week. While those two weak weeks will bring down the 4 week average, it would seem it is in the process of rebounding.
This also matches what the US’s largest auto dealer Mike Jackson of AutoNation told me last week reiterating his projections for the rest of the year.
Concern, the scrap metal reading, While we do expect continued growth in the US, we do want to see this reading level out and rebound. Continued weakness would be a cause for concern. My opinion of it is that after a unseasonably strong Q2 in which scrap traffic was up ~35% over last year there has been a slowdown that is temporary in nature and as we go through Q3, the current trend will begin to reverse. We’ll see….
It will also be interesting to see how this data is reflected across the web tomorrow….
SUBSCRIBERS ONLY, DETAILED NUMBERS BELOW

4 replies on “$$ Latest Rail Traffic…A Drill Down”
[…] This post was mentioned on Twitter by Todd Sullivan, PJ. PJ said: Nice walk through on rail traffic… RT @ToddSullivan: $$ Latest Rail Traffic…A Drill Down http://bit.ly/b4nYac […]
[…] a closer look at rail (and truck) traffic. (Value Plays, Pragmatic Capitalism also Calculated […]
[…] though a summer slowdown may have passed and activity is resuming. These results also back what I said in my last post on rail traffic Journal of Commerce (emphasis […]
[…] We talked about this at the end of July and said that the slowdown we saw in late June early July was temporary and that trend at that time were turning up. Since that time traffic has surged 20k-30k care per week. […]