Davidson submits:
The abyss between the market perceptions of Long Term Business Cycle Value Investors and Short Term Trading Oriented Investors seems to me to never have been wider and deeper than in the current market environment. The desire for instantaneous economic results and daily “actionable information” has led analysts into the realm of sound-bites and since we are now in the digital age the term should likely be “sound-bytes”. Producing for television sound-bytes a form of instant analysis on the latest economic data release that incidentally is only the 1st statistical guestimate and will see future revision, can create the type of circular reasoning that has led to the great investment bubbles of history. We are very likely in one of these today, i.e. a Bond Bubble!
The reason for sending you multiple examples of economic activity that justify a positive investment stance is the simply the fact that Short Term Trading Oriented Investors have so dominated the media that there is no offsetting view available on which to gain perspective. The Donald Broughton interview on CNBC yesterday was the only example I saw in the past 3mos that treated economic data with the longer term perspective that is required. If you had not been watching CNBC 8hrs+/day for the past 3mos, you would have missed this singular individual’s clear headed analysis of goods transport = economic activity and Mark Haines, CNBC Host, disbelief that it meant anything because the “…market predicted the opposite”. This video clip represents the classic delineation between Mark Haines’ “Herd Instinct” and Don Broughton’s thoughtful independent analysis. Haines’ “Herd Instinct” is incredibly pessimistic while Broughton is incredibly positive! I urge you to watch this video several times.
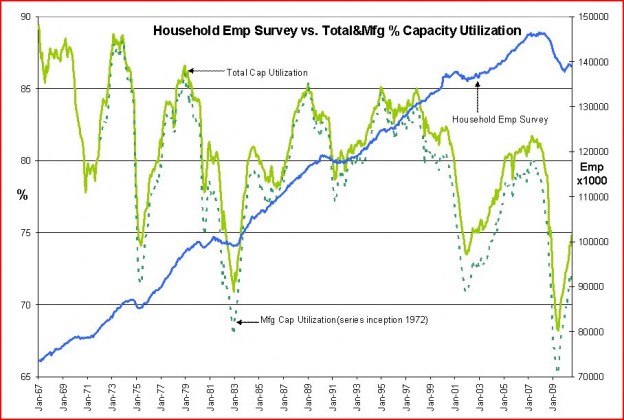
Yesterday, Capacity Utilization estimates* for July 2010 were released with Total & Manufacturing Percent Capacity Utilization being higher by 0.7% and 0.8% respectively versus June 2010. The strong correlation between the Household Employment Survey (the economic momentum proxy) and the Capacity Utilization is shown in the chart below.
*(Note that Capacity Utilization and Household Employment Survey data series are not smooth curves, but each carries hundreds of “blips” that are representative of the data collection process, i.e. statistical sampling, in which minor errors in the data sampling process are amplified many times. For example the Household Employment Survey samples some 60,000 households or about ~240,000 individuals and using an algorithm derived from statistical mathematics scales this to guestimate the employment situation of 309,000,000 individual in the US population. This is a multiplication factor of ~1300x. This means that any error will be multiplied some 1300 fold. This process which has been developed over many decades and refined hundreds of times requires periodic adjustments in part by examining tax returns 18mos later. This means that the July 2010 Household Employment Survey will see adjustments for the next several years. Such are the limitations of capturing real time economic data on a society that is in constant and very dynamic change.)
Broughton’s comment on strong goods transport indicating increasing employment finds considerable support in the corresponding relationship between the Household Employment Survey and Percent Capacity Utilization levels. One should focus on the trends over 6mos+ and ignore month-over-month changes which are, due to statistical sampling limitations, entirely void of value for the competent analyst.
I think it is quite simple to see that the strength in Capacity Utilization since July 2009 indicates that Household Employment Survey should reflect higher employment going forward.
The current market represents an unusual investment opportunity in my experience. While investors have heavily bought and driven 10yr Treasury Yields to 2.5% with their panic response to the media’s relentless pursuit of the Short Term Trading Oriented Investor viewer and in the process heavily sold equities, the economy continues to reveal steady progress. The long term relationship between inflation and 10yr Treasury Yields is ~3% higher. Today this indicates that 10yr Treasury Yields should be over 4% with the Dallas Fed predicting inflation increasing from the current ~1% in the near term. This is a “Treasury Bubble”! This discrepancy in the perceptions of investors is the Long Term Business Cycle Value Investors’ candy store.
It is important to remember that there are many more Short Term Trading Oriented Investors than there are Long Term Business Cycle Value Investors. It is why markets can be driven to low prices even when the economic evidence does not justify this action. Being a Long Term Business Cycle Value Investors requires discipline and patience.
I continue to recommend exposure to equities, but now recommend taking profits in 1/3 of our corporate fixed income allocation as the Return/Risk relationship has become much less favorable. I recommend placing these funds in a short term bond alternative maintaining the recommended 70/30 equity/fixed income allocation scheme.
One last note-summer is always economically slower and one sees this in the railroad car-loadings with Spring and Fall showing seasonal highs.
All the important trends indicate economic revival. Be bullish!

One reply on “$$ Davidson on Employment Trends vs. Capacity Utilization”
[…] A head fake on unemployment claims? (ValuePlays) […]