“Davidson” submits:
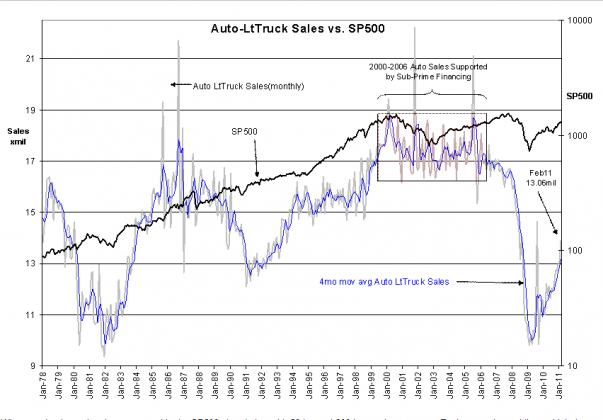
Auto-LtTruck Sales is one of several economic indicators which are helpful to investors-see chart below. Larger purchases and Auto-LtTruck Sales certainly qualify for this category mimic economic activity. Vehicles are one of the necessities of earning one’s income. Vehicle sales often form lows with within months of stock market lows and sometimes as in March 2009 their lows are identical. Mind well, the use of economic data trends is not precise and is designed to assist investing over a business cycle which in recent history has extended 5yrs+.
Many believe that stocks determine economic lows, but my experience indicates that if one looks carefully one will see that it is economics that determines stock behavior.
Market tops have been typically preceded with a fall-off in the pace of vehicle sales which tends to coincide with stalling employment growth. One can see this in the Auto-LtTruck Sales vs. SP500 in Jan 1989 and Jan 2006. The period of 2000-2006 is highlighted as non-conformist as Sub-Prime funding continued to provide excessive vehicle sales through the 2002-2003 recession. I call this the “Dog That Did Not Bark” period after a Sherlock Holmes episode. Employment did stall in 1999 and then fell through 2003. Vehicle sales were very atypical when they did not fall, but other indicators such as employment and etc signaled economic weakness.
Market bottoms are accompanied with up-turns in vehicle sales while employment up-turns follow ~18mos thereafter. The chart shows market up-turns July 1982, Nov 1990 and Feb 2009 which are accompanied by up-turns in vehicle sales Dec 1981, Jan 1991 and Feb 2009. Vehicle sales is not a perfect indicator, but then one does not view the economic world in a vacuum and one must always use multiple inputs. You will quickly learn that no one indicator is good for all seasons. Multiple economic signals will prove helpful when used in conjunction with each other. One of the more reliable is the Institute for Supply Management Purchasing Managers Index which often turns very close to stock market bottoms, but is not as useful for identifying market tops as employment and vehicle sale economic data.
The current vehicle sales pace is in a strong up-trend which is quite positive for equities and shows no indications of the slowing that many traders have indicated they see. What is it that has the traders spooked?
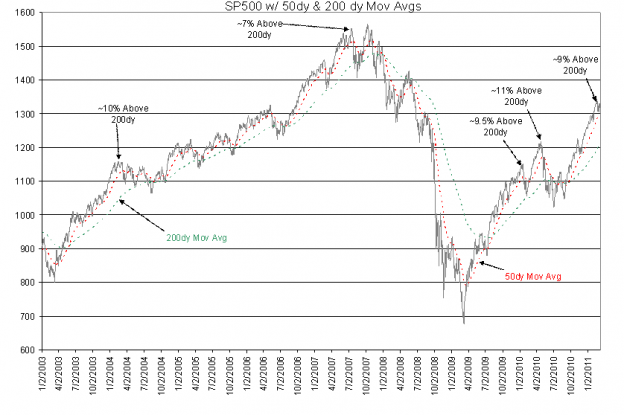
What spooks the traders is represented in the SP500 chart below with 50day and 200day moving averages. Traders watch trend lines which they believe reveal the knowledge that is “hidden” in the market. Traders believe in “The Efficient Market” knowing all that is known and unknown. They are also very short term and never look at economic fundamentals. One of the elements that has them concerned and what they call “over-valued” is the feature of the SP500 being priced some 10% above the current 200day moving average price. Traders claim that this is where the markets tend to “correct an over-valued level”. They claim to be able to value the market on price alone and whenever the SP500 trades ~10% higher than its 200day average that this represents a point at which the market “corrects an imbalance”. I market a couple of instances at which this occurred in the chart, but volatility has followed at other levels often enough to dispel the notion that ~10% carries some special characteristic. I thought you should see what drives trader thinking.
If one is investing for the business cycle, then one learns fairly quickly that no trader has ever called all the market’s “ups and downs” with any notable rate of success. One also quickly realizes that trading the market costs one in higher taxes as short term capital gains are taxed at income tax rates as opposed to the lower capital gains tax rates for the longer than 1yr investor.
Investing using broad economic signals lets one remain exposed to the effects of gradually evolving economic trends and the effects on the markets that can be estimated using historical context. It is far easier to identify the areas of major market highs and lows using economic data than trying to mimic the many traders who try to identify every market wiggle. It is far easier to enter and exit the investment markets using evolving economic data primarily because one is not concerned about capturing a precise “top” or a precise “bottom”. The movement in equities is so large over the business cycle that it is not necessary to be perfect at capturing “tops” or “bottoms”. The goal should be to capture as much of the up-trend as seems reasonably prudent and then to avoid as much of the down-trend as seems reasonably possible.
I remain quite positive with the current development of economic trends and do not recommend losing our long term capital gain tax position for wiggles posed by traders whose records are historically spotty.


6 replies on ““Davidson” on Light Truck Sales and Moving Averages”
Todd
“Davidson” seems to be quite brilliant in his observations and logic. Who is he? What is his background?
I really love reading these postings
he wishes to remain anonymous
Thanks. Please tell him we appreciate his thoughtful insights.
[…] Light truck sales are indicative of economic strength. (ValuePlays) […]
[…] don’t have much confidence in Android tablet PCs.5 financial tech firms worth knowing.Light-truck sales as economic proxy.Job recovery at last! Well, not in California, really.Optimism on the […]
[…] Light-truck sales as economic proxy. […]