"Davidson" submits:
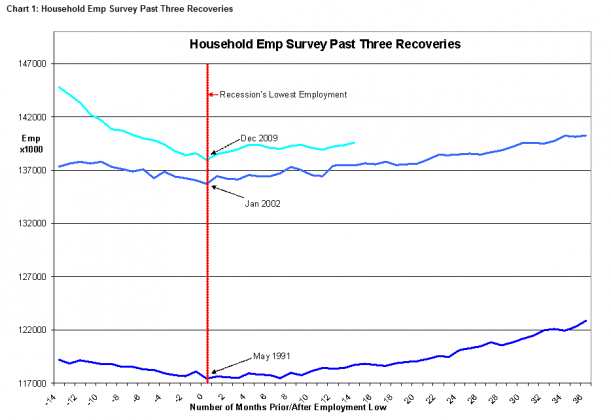
The media has presented many analysts who expressed views that “…this recovery is different” from past recoveries regarding employment. The study in Chart 1: Household Emp Survey Past Three Recoveries reveals that the current recovery is actually similar to the 2002 and 1991 recoveries regarding the comparable rate of employment recovery. One can see that the general trend of the month-to-month rate of change of the current recovery appears almost identical to that in 2002 and 1991.


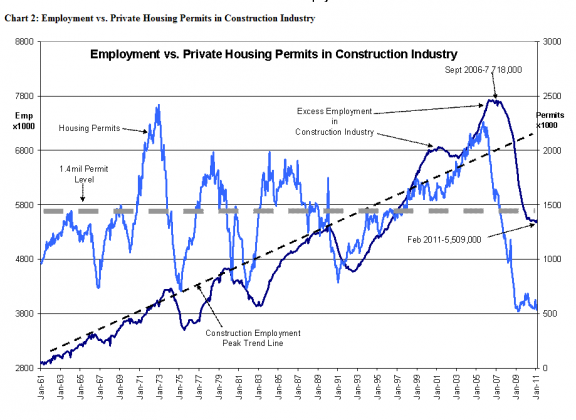
But, what was truly different this time was the stimulation provided by the Community Reinvestment Act of 1995. Government has a long history of providing support for homeownership for various social and political reasons. Periodically, since the early 1960s, there have been surges and declines in the numbers of private homes built reflecting a boom-bust cycle that has averaged ~1.4million new homes each year. See- Chart 2: Employment vs. Private Housing Permits in Construction Industry


Construction Employment (includes all construction residential, commercial and etc) has a defined trend from 1961-Present that one can draw connecting the peak levels of employment that follow the surge of issued housing permits. What should be clear in Chart 2 is that Construction Employment soared after the Community Reinvestment Act of 1995 as government pressed banks to lend to the less fortunate. Excess lending led to excess employment which was nearly 1million above the peak trend line in Sept 2006-Peak Trend Line level of ~6,800,000 vs. Construction Employment of 7,718,000. This created excess employment in associated industries as well. One of the features of the excess lending during the years leading to this peak was “Sub-Prime” lending which included lending for car and light truck purchases in the form of home equity loans. This was even before Sub-Prime homeowners had created any home equity!!
Excess within an economy is never limited solely to a single industry.
The excess Construction Employment of 2006 on correction resulted in layoffs of ~2.2mil individuals in construction alone (Sept 2006-7,718,000 fell to Feb 2011-5,509,000) which represented ~25% of the 8.4mil individuals laid off from 2006 to Dec 2009 as the recession gathered strength. With housing being one of the basic industries of the US economy, the devastation to employment rolls was widespread as even industries thought minimally connected proved not exempt. The economic excess that led to our recent recession in spite of the many denials by elected officials can be laid to the political desire to stimulate homeownership in my opinion.
Almost everyone in and out of government thought Sub-Prime lending was a wonderful idea as the results piled in one on top of another. Unfortunately the I.O.U. was mountainous!
Net/net, this recovery appears quite similar to previous recoveries.
Categories