Saw a few tweets today in regards to LinkedIn’s ($LNKD) IPO that simply said “PE is a horrible way to value a company”.
That’s a crock…
Eventually, it matters very, very much. Two thing happen when a stock trades at an atmospheric PE for a long time. Either it stalls until earnings catch up to it….OR it comes down to a reasonable PE level. Lets look at at some examples. I’ll use two with $GOOG and $DELL but we could just as easily use $YHOO, $MSFT, or any other tech high flyer for that matter.
First Google, here is the chart:
Now we should first note here that unlike recent IPO’s, Google was actually solidly profitable when it went public. Further, it had grown those earnings 256% the year prior to its going public. The first full year post IPO Google grew earnings another 240% and the stock rocketed up to $466 dollars and an 93 PE. In 2005 Google grew EPS another 98%….but its stock? Unchanged for the year. It’s PE had begun to contract to normal levels. That process would continue for the next 5.5 years
Today? Google sits at $531 a share and trades at a 20PE. What happened? Did Google fail to perform? No, in fact earning have compounded 39% annually for the past 5.5 years. It’s stock? It has returned 2.4% compounded for the past 5.5 years. Why? If PE’s do not matter, shouldn’t Google be selling at 30x or 40X earnings now? In fact, Google grew EPS 29% from 2009 to 2010 so couldn’t we call it a “growth company”? It is because PE’s do matter at the end of the day. Google is an example of a company that has performed fantastically for near a decade but who stock for most of it has gone nowhere…..the lesson is companies always eventually trade at a normalized PE level. Because Google still performs, its stock simply has stalled while earnings caught up.
Dell?
We’ll skip the “techwreck” of 2000 so as to not be accused of picking a time all of tech got it. We’ll pick our story up in 2002 post crash, post 9/11.
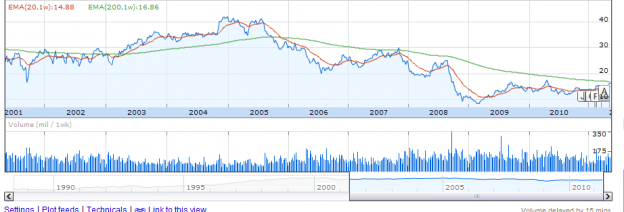
Here is the chart:
From 2002 to 2005 Dell grew EPS 25% annually and shares hit a high of $41 at the end of 2004 where it traded at a PE of 40. Since then EPS has grown at an anorexic 2.9% and shares have returned a negative -13% annually over the same time frame. Today’s PE? 9. Go ahead, pick a company and do the exercise, eventually it happens. Now, we can pick a 6 month or 1 year or even 2yr time frame and yell “I didn’t happen then!!” Remember I said eventually, it happens.
Even today’s hotly contested stock $NFLX from 2007-2009 as it grew EPS 36%, 36% and 50% in those years sported PE ratio’s for them of 27, 22, and 28 times those earnings. So, when I look at a company like $LNKD get a $9B valuation when it earns, um , nothing, I wonder. Let’s play with some numbers and assume $LNKD will grow at a phenomenal rate and will give it a PE ratio of 50 times earnings. What has to happen? For $LNKD to keep its $9B valuation and garner a 50PE, it has to grow earnings to 180M. Can it? Well, lets consider it’s best year ever was 2010 when it earned $15M…..yes, $15M.
We also have to note the company has said it will lose money in 2011.
From 2008 to 2010, our net revenue grew from $78.8 million to $243.1 million, which represents a compounded annual growth rate of approximately 76%. We expect that, in the future, as our net revenue increases to higher levels our revenue growth rate will decline over time, and we may not be able to generate sufficient revenue to sustain our profitability. We also expect our costs to increase in future periods, which could negatively affect our future operating results. In particular, in 2011, our philosophy is to continue to invest for future growth, and as a result we do not expect to be profitable on a GAAP basis in 2011. We expect to continue to expend substantial financial and other resources on:
There is also this disclosure regarding its members:
The number of our registered members is higher than the number of actual members, and a substantial majority of our page views are generated by a minority of our members. The number of registered members in our network is higher than the number of actual members because some members have multiple registrations, other members have died or become incapacitated, and others may have registered under fictitious names. Given the challenges inherent in identifying these accounts, we do not have a reliable system to accurately identify the number of actual members, and thus we rely on the number of registered members as our measure of the size of our network. Further, a substantial majority of our members do not visit our website on a monthly basis, and a substantial majority of our page views are generated by a minority of our members. If the number of our actual members does not meet our expectations or we are unable to increase the breadth and frequency of our visiting members, then our business may not grow as fast as we expect, which will harm our operating and financial results and may cause our stock price to decline.
Let’s run some more numbers and we’ll base this off the $9B market cap the company sports today and run 100PE and 50PE scenarios:
Scenario #1: For a 100PE the company needs to earn $90M dollars, up from a projected loss in 2012. In 2010, the company’s NI was 6% of revenues. That is the high water mark so we will use it. That means $LNKD must generate $1.5B in revenues at its best rate and $4.5B at its current 2% rate to earn $90M. Given the company’s project loss for 2012, the 2% number is the most likely number for the immediate future based on the stated cost increases the company expects and we’ll assume a return to profitability in 2013 (no sure thing there).
We can feel comfortable using the numbers because as revenues in Q1 rose 110% in 2011 vs 2010, the cost of that revenue grew 102% and stayed flat as a percentage of net revenue. Simply put costs are rising in the same % of revenues so the above %’s are not likely to materially change. I also will not attempt to use EPS #’s for $LNKD as I am more than sure there will additional shares and substantial dilution coming onto the market before Xmas.
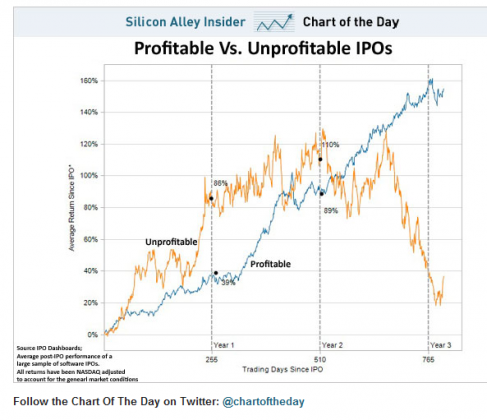
Scenario #2: Running the same scenario for a 50PE, we get NI of $180M. At 6% of revenue, $LNKD must reach $3B of revenues and at 2%, $9B. What time frame do you want to give them to justify a $9B valuation? 3 years? That is past the time frame for the “unprofitable IPO” to crash but we’ll run w/it and give them the extra year  Now you’ll note above that the average for the “unprofitable IPO” is about $110% after two years. This would be the time to point out that $LNKD essentially did that today so one has to wonder how much more upside there is. We also would be remiss if we did not also say here shorting $LNKD now is not possible and there are no options available to buy puts in until at least 5/27. So, the only people in the market now are bullish.
Using the three years above Scenario #1: Revenues must grow 83% annually at 6% and 164% at 2% Scenario #2: Revenues must grow 131% annually at 6% and 233% at 2%. Note: these revenue growth numbers are all above the growth $LNKD saw from 2008-2010 and we all know that as these numbers get larger, it gets far harder to continue to grow them at these rates. Does this mean the company sucks or is doomed? Hell no. It does mean anyone trying to sell you shares near $100 ought to have a very tough time convincing you to buy them.
There is a reason that the market has historically traded generally between 10X and 25X earnings. There is also a reason when it has hit the extreme on either side the market has moved to a more “normal” level. This is a multiple range investors are willing to pay for the earnings of a company. There are certainly times when PE ratios become egregiously low or high. In the short run, anything can happen. It is also those times that present wonderful opportunity, just ask those who shorted in 2000 and those who were buyers in 2009.
Is PE a “be all end all”? Of course not. NO one indicator is. To say it is meaningless or has “no value” to measure growth companies simply makes no sense. In reality we know with “high flyers” one of two things will happen, earnings will catch up to valuation as the stock eventually stalls, or the stock will come down to earnings. In the short run no metric really matters as the market and the stocks in it gyrate indiscriminately day to day, week to week and even month to month.
But to say over time a metric that has mattered for as long as the market has existed doesn’t matter is simply foolish….just ask the same people who in 1999-2000 said we were in a new economy where “clicks” , “page views” or “EBITDA” were more important than PE. The simple old PE ratio was “outdated” then also……until they found the hard way PE does matter and it became very relevant very quick.


2 replies on “Yup, PE Does Matter….”
[…] Oh yea…..lets pretend they manage to make a penny vs the loss they expect this year. That would put the PE ratio at 14,700? We all know what happens to these high PE stocks.… […]
[…] This is obscene. A lot of people are going to get burned buying shares on these recommendations on a company that has admitted it will not make money anytime soon……..if ever. For those interested, here is the first post I wrote on the subject […]