“Davidson” submits:
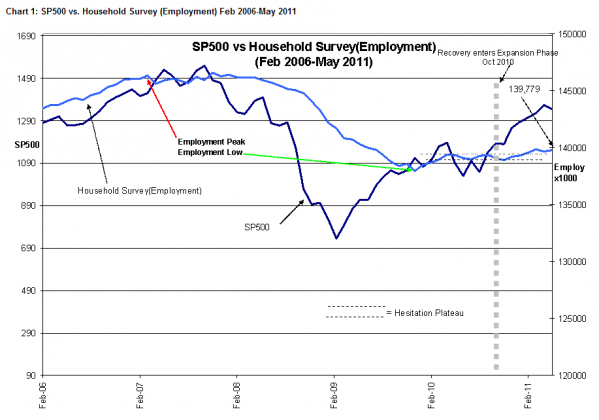
It seems that every release of economic data causes an immediate discussion of what is wrong with the world, with the US or with our economy. In the larger scheme of our economy the Household Survey employment figure for May 2011 rose by 205,000 from April 2011 and in the opinion of most respected economists is a better measure of employment trends than the Establishment Survey which showed a disappointing 54,000 increase.
The key issue of understanding economic reporting and turning the data which comes out weekly, monthly and quarterly into viable investment action is counter to that which one sees everyday in the media. The media is chocker-block full of advisors offering “immediate and actionable” advice on the “economic report of the moment” based on an expected change from the previous month. If the report is lower or at the same level as expected the markets are disappointed and sells off immediately. Only if the report exceeds expectation can there be a positive response and sometimes not even then. The problem with this type of “immediate and actionable” advice is that each separate report carries little useful information by itself and to act on it without the context of the preceding 6mos-12mos is an effort wasted. It is the trend that is most important and as one can see in Chart 1: SP500 vs. Household Survey (Employment) Feb 2006-May 2011 there is a continuation of the uptrend in this data series.
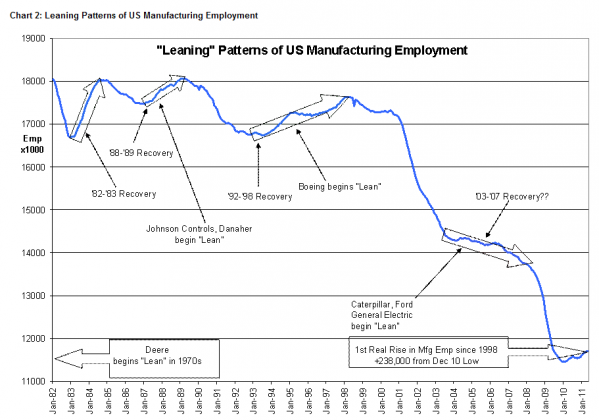
Also reported today from the Establishment Survey was a US Manufacturing Employment level for May 2011 of 11,694,000 vs. a revised April 2011 level of 11,699,000 (Revised from previously reported 11,706,000). Wall Street focuses on the drop of 12,000 manufacturing jobs and adds to concerns unnecessarily when the drop from the revised level was only 5,000. Economic data series are never precise!! The revised rise in US Manufacturing since the Dec 2009 low is now 238,000 as opposed to the earlier figure of 250,000, but this still represents a decent up-trend. Chart 2: Leaning Patterns of US Manufacturing Employment shows the trend in this data series.
What one should be impressed with this data is that even with the seasonal slowing that occurs each year and the impact of the Japanese tsunami on US industry and the record tornado activity in the US that occurred the past 6wks, the general employment is higher and the reported expected broad losses in manufacturing employment seem quite muted. One can infer from these reports that the economy is strong enough to absorb these calamities without much impact.


One reply on ““Davidson”: Employment Rises By 205,000!! Up-Trend Continues So What Is The Fuss?”
[…] Hard to put a positive spin on today’s non-farm payroll numbers. (Calculated Risk, Money Game, FT, Free exchange, Planet Money, Felix Salmon, Mark Thoma, ValuePlays) […]