“Davidson” submits:
This study using May 2011 as a starting point is designed to make the point why hanging onto each monthly employment report for an actionable data point is sheer lunacy.
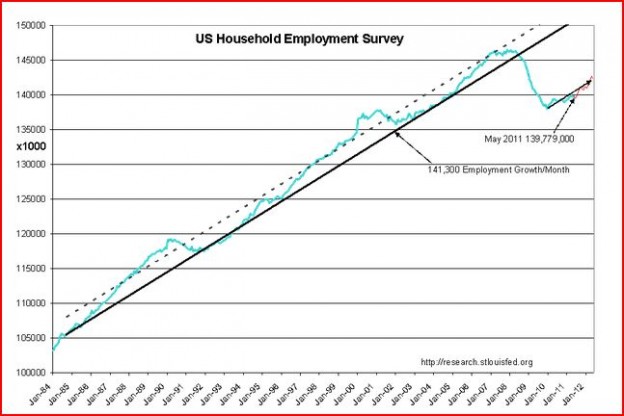
Taking the May 2011 figure of 139,799,000 employed and adding the historical growth rate of 141,300 employed each month, the next 12mos of anticipated employment gains were calculated and plotted with the error of +/- 436,000 as determined by a roll of a die even or odd. This simulated the process of interviewing 60,000 households and applying an algorithm to scale the results to an estimated ~310,000,000 US population which has a known error of +/-436,000. The volatility in the simulated data(shown in RED) is similar to that seen historically.
What this says is that while monthly data is hit or miss as to the precise number of the employed due to the data collection process, the actual trend appears quite clear with 6mos+ of data.
It is quite impossible to trade on slight variations in anticipated monthly reports when the each data point can vary by +/-436,000.

One reply on ““Davidson” on Employment”
[…] Todd Sullivan: “Davidson” on Employment […]