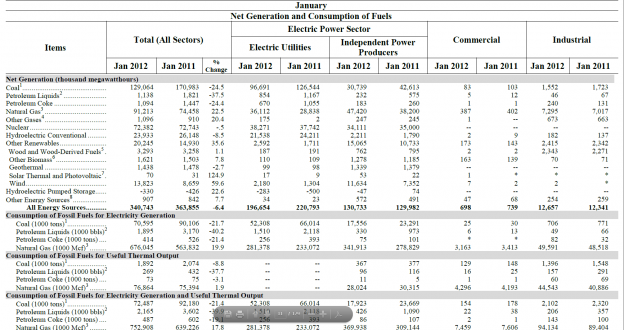
Total N. American rail traffic rose last week to 663k cars despite another fall in coal shipments. We have documented the “why” as to coal’s decline before, the massive switch to natural gas for electric generation. For proof simply look at January’s data from the EIA, we see the YOY collapse in coal and a corresponding rise in Natty for electric generation (full report here):
Since gas is transported by pipeline and coal by railroad, the weakness in the data is not due to an economic slowdown but by a shift in fuel and and way it is transported. In reality, all other categories of rail traffic, the “what is being hauled” sit at or above multi-year highs telling us the economy is still improving.
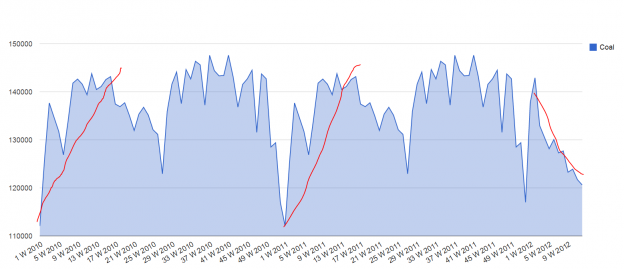
To see the effect of coal, I have graphed shipments from 2010 to now:
Notice the disconnect from ’10-’11 to today through 13 weeks.
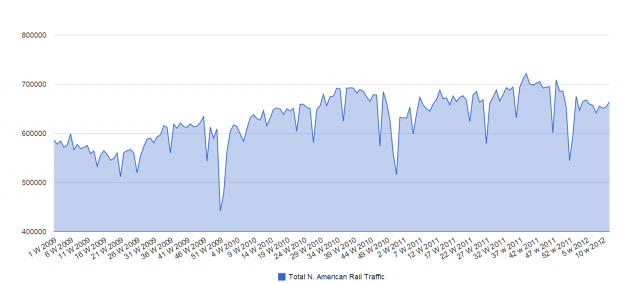
Here is the chart on total rail traffic. Had coal traffic be even near last year’s numbers total carload would be well ahead of last years numbers. So, why we may start to see some weakness from the rial companies due to to collapse in coal shipments, this in no way should lead one to correlate that to overall economic weakness.


3 replies on “Rail Traffic and The Coal Effect”
[…] The effect of coal shipments on rail traffic. (ValuePlays) […]
[…] for the past 4 years to give you a point of reference on the degree of coal’s plunge. Click here to see the reasoning for the coal […]
[…] 13? for the past 4 years to give you a point of reference on the degree of coal’s plunge. Click here to see the reasoning for the coal […]