“Davidson” submits:
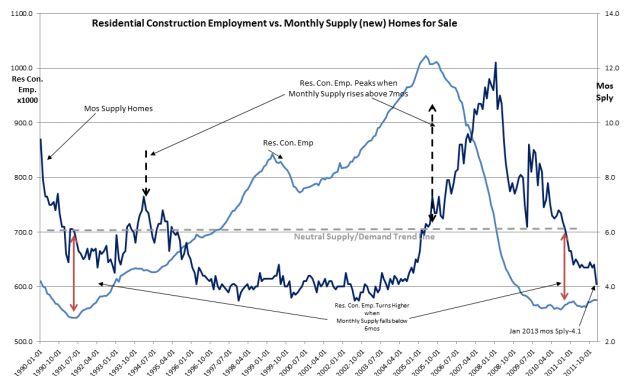
New Home data was released yesterday with the Monthly Supply of (New) Homes for Sale coming in at a very bullish 4.1mos. 4.1 mos is in the range of the most positive period in home building history-1996-2003. See chart below. Accompanying this is a rise in Residential Construction Employment. For every new job in this economic sector equates roughly to ~8 new jobs elsewhere in our economy.
The economic news continues very positive for equities in spite of the recent spate of negative commentary in much of the media. The US economy is ~$15tril and 310mil individuals working diligently and seeking to improve their standards of living. Once set on a trend of expansion, the trend has always continued virtually uninterrupted till the economy moved to excess. Only when the economy has exhausted its buying power does hiring slow and the signs of economic maturity revealed. Based on the fact that Residential and Commercial Construction sectors are only just now moving off of historic low levels, one can estimate that the pent-up-demand built since 2008-2009 will require 4yr-6yrs of vigorous activity to recover to levels typical of our society.
Contrary to the media the economy does not have the ability to start and stop with rapid spurts in between. Any economy is controlled by millions of individuals and billions of tons of goods being moved from place to place. Decision making by businesses are carefully considered. It takes 2yr-3yrs to build a large factory and no CEO is going to control the pace of construction, hiring and firing contractors based on the ever varying reports in the media about the direction of the economy. It is not one day they are working and the next they are not. It is those who are traders who fail to see that statistical data requires several months of readings before one can come to some conclusion regarding economic trends. A single month’s data point carries little meaning when it is interpreted out of context with the trend of the past 6mos. Yet, this is what many do and investors are barraged with immediate “calls to action” when single data point interpretations are truly worthless.
The data below and the many others which I send to you indicate that the economy is not only reasonably well, but improving. This is what changes market psychology and causes equity prices ($SPY) to rise to their highest points over time.
I remain optimistic. We have yet several years of economic improvement. I recommend that investors add funds to accounts. I recommend that LgCap Domestic and International equities appear the most undervalued by my analysis and that investors should avoid Fixed Income, REITS and Emerging Markets as overvalued.*

2 replies on “New Home Inventory Continues to Fall”
[…] How shrinking housing inventories could push home prices higher. (Modeled Behavior also ValuePlays) […]
[…] New Home Inventory Continues to Fall ValuePlays […]