“Davidson” submits:
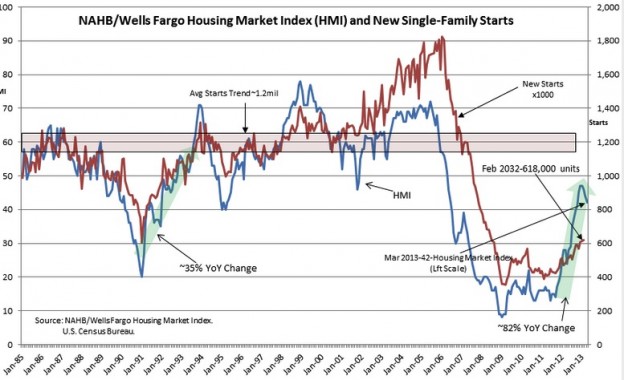
he National Association of Home Builders Housing Market Index (HMI) was reported at 42-see the LIGHT BLUE LINE. This series like all economic data series is volatile. While some are expressing concern at the 5pt drop from the Jan 2013 report of 47, I note that the New Single Family Starts series has gained momentum-see the RUST COLORED LINE. The economic trends of improving residential housing remain intact. One should never use a single data series for investment decisions, but determine if multiple data trends are providing correlated signals. Thus far, the overall direction for residential housing activity remains in an uptrend.
The next report to watch is the Monthly Supply of Homes For Sale. The last report was well into the ~4mos supply range which indicated strong demand for single family homes. The demand for building lumber has been rising for some time-see the chart Mark Perry provided on lumber prices below. The demand for lumber in early 2009 actually tracks remodeling activity which bottomed at the same time. Remodeling is cheaper than buying a new home and this index showed that while the activity slowed markedly due to the market correction in 2008-2009, there was still activity as people continued to have faith in the future. The data for HAHB’s RMI (Remodeling Index) can be found at this link: NAHB Remodeling Market Index
The net/net is that trends continue positive for equity ($SPY). The history of volatility in these data series can be seen the HMI chart. Volatility is present in all economic data. Single or even 3mo or 4mo deviations are never grounds for changing ones investment direction if other data can be seen to continue complementary trends.
Optimism for higher equity prices in the year ahead remains warranted*

One reply on “NAHB Uptrend Continues”
[…] Housing starts accelerate in March. (Bloomberg, ValuePlays) […]