“Davidson” submits:
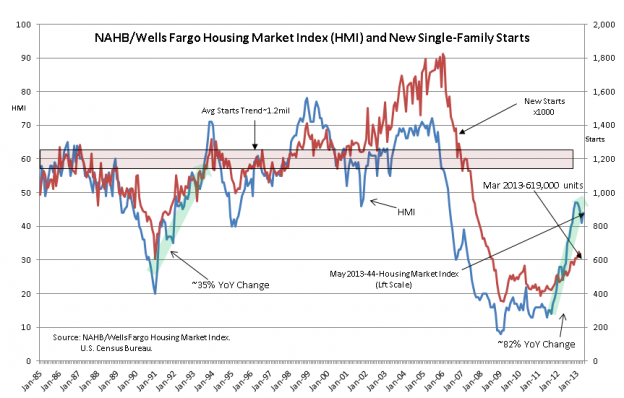
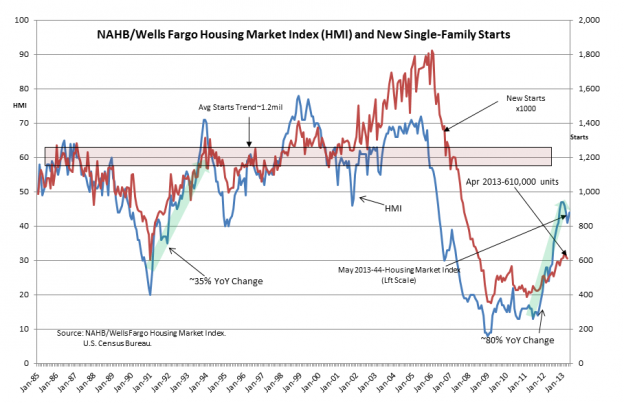
The National Assoc of Home Builders reported the May 2013 HMI(Housing Market Index) at 44. This indicator is a sentiment indicator of home builders and while it is a confidence indicator and not a hard number count of home building activity, the fact that it is a survey of a very narrow sector of our economy is likely why it provides a good forecast of housing activity. At 44, the HMI remains in a strong uptrend and we should expect an expansion of home building in future months.
Positive trends in the HMI are good for stocks. Optimism continues warranted for a higher stock market in my opinion
“Davidson’s” other note below is prescient also. The media lives for melodrama and when they cannot get it, they create it. Sadly I am finding many blogs, once the more reasonable of the two medium are following suit and we are seeing many of them derive long term trends from a single data point. In a rush to be the first to “call it” we’ve seen countless dramatic predictions over the past three years none of which have come to pass. Since 2010 I have been saying that we were in store for a long, grinding and unspectacular recovery and to ignore those screaming “recession!” every time a single economic data point slightly misses a “consensus”. It was and has been an incredibly boring but highly accurate prediction. You can find dozens of posts from 2011 and 2012 repeating the same theme.
I am actually seeing the media talk of a “housing bubble” lately in a seemingly desperate attempt to create worries. This astounds me as it defies not only the economic reality but the laws of common sense. How can we be having a bubble when lending is still so tight? How can there be a bubble when the largest complaint from potential buyers is that they cannot find inventory? How can we have a bubble when the current sales data is still well below historical norms (“bubble” denotes extreme, right?).
The “housing bubble” talk is predicated on a singular data point, home price increases. The argument seems to be that because price is up “X”, and “X” is a large number, we must be in a bubble stage. This of course ignores where “X” started from (50% drops in many areas), the fact that from 2008-11 an immaterial amount of new single family housing was built in the US, that despite that we still added over 1M new household formations a year and that these people need a place to live. Supply and demand is a powerful phenomena many folks seem to miss. What you are seeing is repressed demand for housing taking advantage of low prices and generationally low lending rates. That is rational behavior, not bubble like. Because there is so little inventory due to lack of building prices are rising.
Those focusing solely on price in housing are the same one who have been predicting the market was going to reverse for the last three years simply because “it has risen by so much”. Fundamentals drive price and the fundamentals of housing suggest a long sustained recovery. I do expect price increases to cool off as supply come back online (builders can’t keep up w/demand in most areas) but when that happens transaction volume will increase. This will lead to more jobs, etc…
Fortunately if one wants to remember a housing bubble, just go back to 2006 when your barber was buying and flipping homes in Florida or Vegas in between hair cuts. We are nowhere even remotely close to that now. Wilbur Ross has the best housing bubble story (I am paraphrasing):
During the downturn in ’08 Wilbur was playing golf in Florida. His caddy asked him at the end of the round is he could ask him a financial question. Ross replied “Sure”
“I own some condos in Vegas and are underwater in them, do you think I should sell them or hold onto them” ask the Caddy
“Well, where in Vegas are they?” said Ross. “Are they in a good areas? What condition are they in? Are there businesses around them? Are they located in a strong rental market?”
“I don’t know” said the caddy, “I’ve never been to Vegas”
THAT is a bubble
“Davidson” again:
Yesterday the Census Bureau released the Apr 2013 New Single Family Starts report at 610,000, but March 2013 was revised from the 619,000 reported last month to 623,000. If one looks at the RED LINE in the chart below, one can see that the monthly volatility forms a nice uptrend and that volatility and revisions are a normal feature of economic data.
The interpretation yesterday by the media that yesterday’s report in some fashion represented a “top” in housing or a slowing of economic activity is a gross misreading of the pace of our current economic activity. The financial media were awash with comments that this was a “Plunge” from the previous level and that this represented a slowing of economic activity. It was not!! This reading was in line with the trend of late 2011.
If the media and the many media forecasters did not misinterpret economic data so frequently(the misreads are a daily occurrence), I would not have to counter this information with multiple weekly notes. But, it is what it is and longer term investors cannot let the media be the basis for investment decisions.
The economic news remains positive and we should expect higher stock prices over the next 18mos (barring an event which turns market psychology temporarily negative). Over the long term, the economics have always developed in the same general historical pattern regardless of near term market psychology. Eventually, market psychology is driven by positive economics and markets have typically been priced in excess of the SP500 ($SPY) Intrinsic Value Index which is ~$1,750 today.


One reply on “Housing Update”
[…] of another housing bubble is premature. (ValuePlays, Term […]