“Davidson” submits
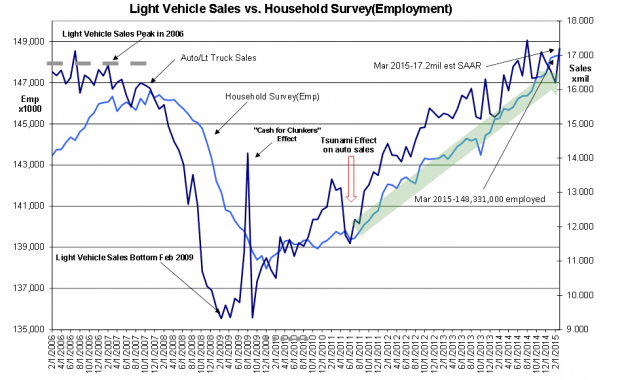
Many interesting reports last week. The March 2015 employment reports caused many to express disappointment, but the Household Survey was higher by 34,000 and is in line or may be revealing a higher trend than shown on the chart below. If you cannot see the acceleration in employment, send me a note and I will be happy to review it with you. Light Vehicle Sales at 17.2mil SAAR(Seasonally Adjusted Annual Rate) reflects continued economic expansion-see chart Light Vehicle Sales vs. Household Survey(Employment)
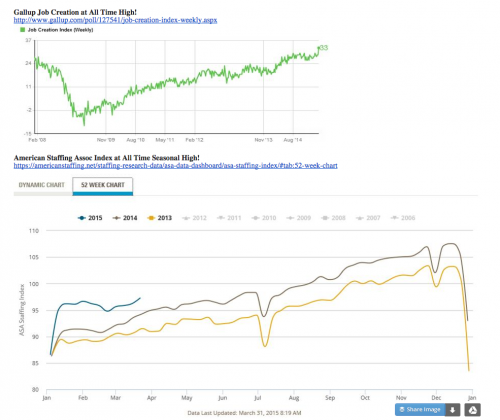
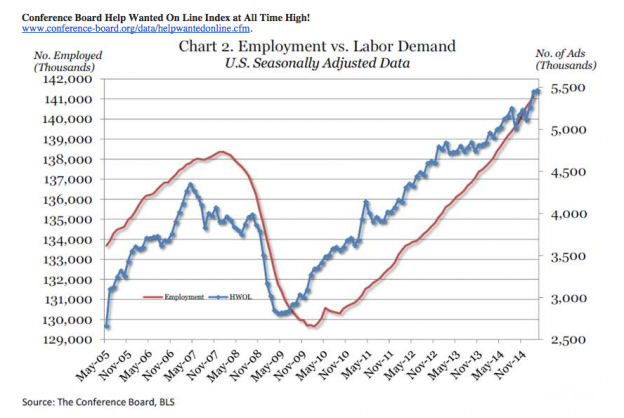
The American Staffing Assoc Index, Gallup Job Creation Index and The Conference Board Help Wanted On Line each hit all time highs-see charts below. These also suggest the employment trend may be accelerating.
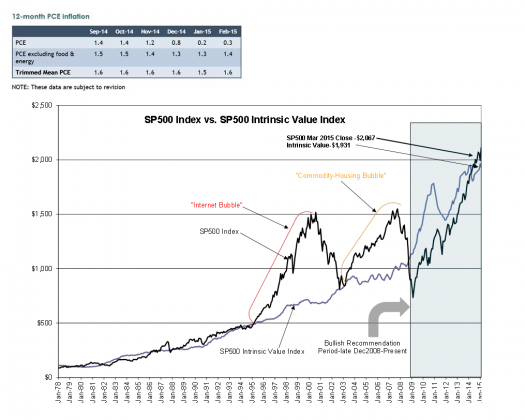
Finally, the SP500 ($SPY) vs. SP500 Intrinsic Value Index-see chart below-remain fairly close. The Dallas Fed reported the 12mo Trimmed Mean PCE at 1.6% which leaves the Intrinsic Value Index at $1,931 vs. the SP500 at $2,067. The SP500 Intrinsic Value Index is an indicator of speculation or measure of dominance of equity prices by the Momentum Trader crowd. That equity prices remain closer to historical low valuations when compared to past periods of heavy speculation of 1995-2000 and 2004-2007 shows that even with current pockets of excess pricing, the SP500 does not reflect much speculation.
In my opinion, Hedge Funds have dominated securities markets since 1995. Fixed Income appears to be in bubble territory with the 10yr Treasury rate below 2% when the historical relationship to US GDP suggests it should be closer to 5%. I think we are likely to see a reversion to 10yr Treas/GDP historical relationships once investors abandon the safety of bonds for the returns of equities. Exactly when this occurs is impossible to predict, but that it has occurred every investment cycle in the past is part of our history.
Economic trends continue bullish for equities.


