“Davidson” submits:
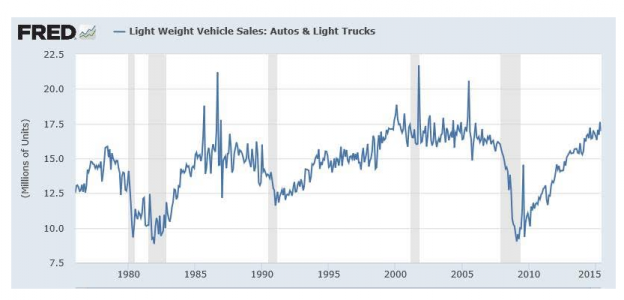
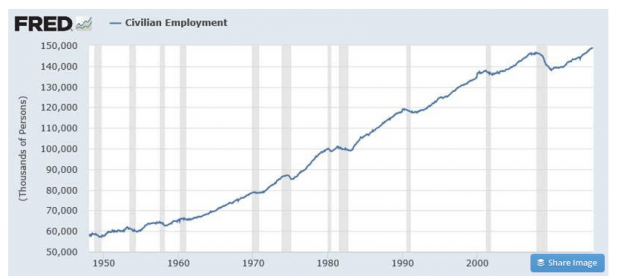
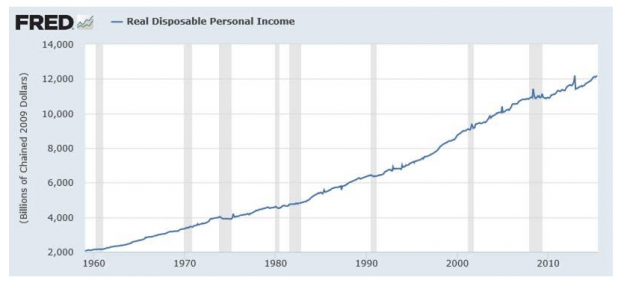
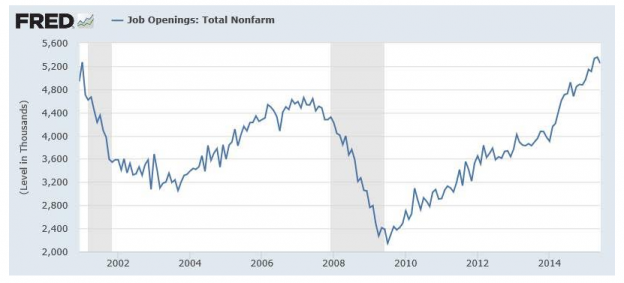
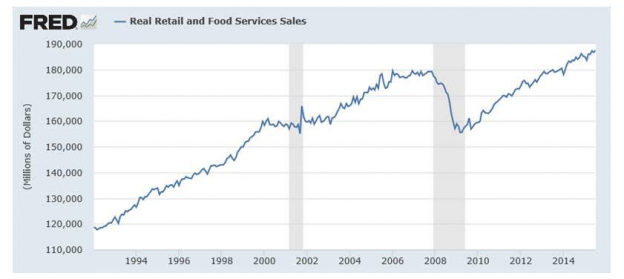
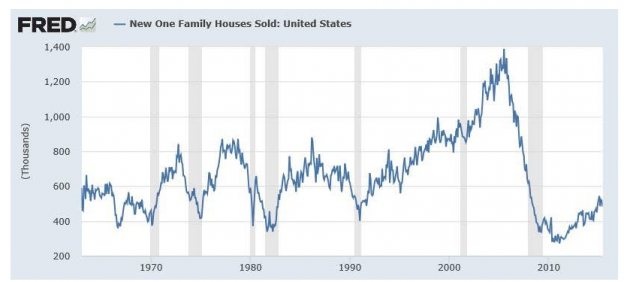
Record Vehicle Sales! Record Household Employment! Record Real Disposable Income! Rising Job Openings! Record and rising Retail Sales!! Rising Single-Family Home Sales yet well below historical norms! 321Million+ and rising Americans still want homes, cars and raise their standard of living. Most of these provide ample warning of economic and market tops. No top in sight today! See the charts attached below.
A rising US economy has never been the stuff of major corrections. In fact history shows that it is the economic activity of the US which is the global driver till the US corrects from excess. There are quite a few examples of how this works. The Thai Bhat/Asian Currency Collapse/Russia Default in the late 1990s did not stop the global economy till the US economy peaked in 2000. The US$ is the dominant global currency. It was US inflation which became a global problem in the 1970s. It was the US which reversed this in the 1980s and caused global interest rates to collapse the next 20yrs. This time it is technology invented in the US which has resulted in lowering the finding costs of oil and gas which has impacted the global energy prices. The ‘Arab Spring’ had its basis in communication technology invented and then distributed by the US but made in Asia. The reason for China’s rise the past 20yrs has been technology invented in the US seeking to lower costs and expand to foreign markets. It is the US which has been the technology leader in every category since WWII.
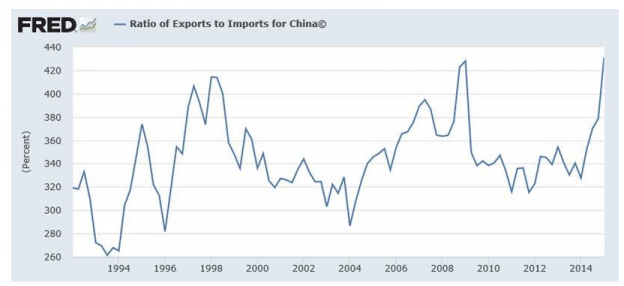
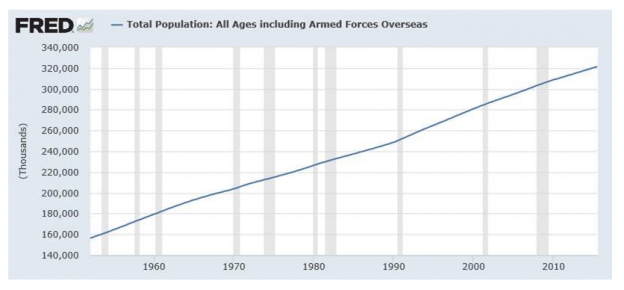
It is also the US which consumes ~70% of its own GDP which makes it the driver of the global economy. The US has dominated the global economic cycle since WWII with our inventiveness, our consumption and our drive to improve our standard of living. Demand for goods and services by US citizens is directly dependent on how many there are of us. 321million+ at the last official estimate and growing. We make many things in foreign nations for export back to the US. China has been and remains a huge beneficiary of this, i.e. US imports ~$40Bil and exports ~$10Bil with China. China depends on exports of manufactured goods. China’s consumption of its own GDP is estimated to be less than 50%. Probably much less! China is a Command Economy and publishes the economic figures it wants the world to see. The many cities remaining empty constructed under government dictated programs make Chinese GDP higher than its real economic activity supports. The OECD chart below provided by the St Louis Fed below shows the Ratio of Exports to Imports for China, about 4:1 globally. A good part of China’s economic growth is the engine of US consumption, US inventiveness and US sales of goods made in China for export to overseas markets. For example, Apple sells ~50% of all iPhones globally, but makes them all in Mongolia, China, Korea and Taiwan. The US is in a long process of implementing ‘Lean’ manufacturing processes and the US manufacturing base has taken a decided turn higher for the first time in decades. China and other low cost manufacturing venues are suffering as US companies bring production back to the US. The term is called ‘Reshoring’. The US is gradually regaining its prowess as a global manufacturing leader through ‘Lean’.
The market activity we see today, I attribute to Hedge Funds reversing bets made on chasing market momentum which has turned on them. I have noted this behavior multiple times. China, oil, Social Media issues, Biotech issues and currency swings (and more) have all been part of the mix. When they are forced to reverse in one market, Hedge Funds must sell all other markets to meet daily margin calls. This is the basis of today’s volatility. An observation I have made many times in the past remains just as valid today. As long as economic activity continues in an upward trend, which is what the data reflects, then the misdirected decisions by one sector of investors who invested wrongly can cause temporary volatility but, it has no impact on the trend of economic activity in the US.
I am sure some one will bring up the term ‘Black Swan’ to describe current market activity. ‘Black Swan’ is the misunderstood connection between markets and economics. ‘Black Swan’ is based on the belief that falling markets leads to falling economic activity. Historically it is US economic peaks which lead to major global market corrections. Many do not see this connection and because they are only watching markets and not economics. They are negatively surprised. ‘Black Swan’ is their term. They say with authority that ‘No one can predict a Black Swan!’ Actually, it is they who cannot predict a ‘Black Swan’.
Economics tell us that a ‘Black Swan’ is not facing us today. This is only some $3Trillion in Hedge Funds correcting over-crowded trades which are going against them. Give it 6mos and the economic trend should come to back as the longer term driver. The major problem with economic activity is that so many are influenced by it yet they do not truly pay enough attention to its impact to understand how it operates.
My recommendations remain the same and with prices being lower I can only be more emphatic that investors take advantage and add to equity positions. The better Reward/Risk assets in my opinion remain LgCap Domestic and Intl issues as well as Natural Resource issues. I have and continue to recommend investors avoid the ‘highfliers’ which the media discuss as growth issues day after day after day. Many of these companies are not growing Shareholder Equity. They are spending often more than they are taking in to expand business. Bottom line-if you are not growing Shareholder Equity and/or dividends, then you are not growing value for shareholders.
