So, the question people must be asking is: Why? Falling oil price are supposed to utterly collapse the Houston housing market yet it continues to set records a year after oil prices began their collapse……how can this be happening? As I’ve said before, Houston’s fortunes are not solely tied to oil and gas. To be sure it plays a significant role, but not the overwhelming one it did in the 80’s. The economy is far more diversified and new residents are moving to the city daily, causing continued increased demand for housing.
The area’s supply of homes sits at 3.5mos, well below the nation’s 4.8mos and is only 60% of what would be considered “equilibrium”. This means continued strength for developers like $HHC
And the city has gained over 64,000 jobs over the last 12 months, even though woes in the oil business have plagued the economy and things are expected to get worse.
And population has been increasing significantly with an estimated 1,000 people a week moving to Houston. This has driven home prices upward, tightened the housing supply and outstripped the ability of home builders to build houses fast enough.
“The problem with the residential market is we can’t develop enough lots. That’s the issue,” says Patrick Jankowski, regional economist with the Greater Houston Partnership. “We need to get more lots developed. If we could create a few more, it would lower lot prices, which would lower home prices.”
The Houston area’s population soared to 6.6 million last year, a gain of 156,000 people from 2013. Some of those numbers represented children being born, but there thousands of newcomers relocating to town.
Something to point out in the 1st paragraph below. They note the market “eased off the accelerator” as sales were comparable to 2014. One should note that 2014 was the best year in the history of the Houston housing market. So the headline could just as easily be “Market maintains record pace” . It is a small thing but I think it matters….
Har:
HOUSTON — (September 9, 2015) — After a couple of months of rising sales, the Houston housing market eased off the accelerator last month, with sales comparable to August 2014 and prices setting new August highs. Homes priced between $150,000 and $500,000 saw moderate gains, with the low and high ends of the market experiencing sales declines.
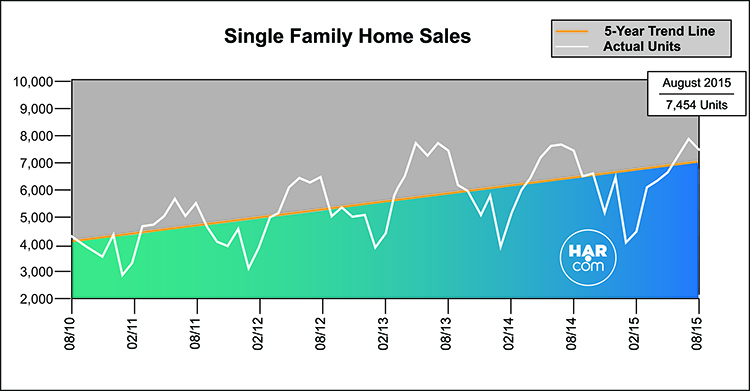
According to the latest monthly report prepared by the Houston Association of Realtors (HAR), August single-family home sales totaled 7,454 units compared to 7,407 a year earlier, an increase of less than one percent. The time it took to sell the average home held steady at 45 days.
Months of inventory, the estimated time it would take to deplete the current active housing inventory based on the previous 12 months of sales, rose from a 3.0-months supply last August to a 3.5-months supply. That is slightly above the 3.4-months supply in July 2015, but remains below the current national housing supply of 4.8 months of inventory.
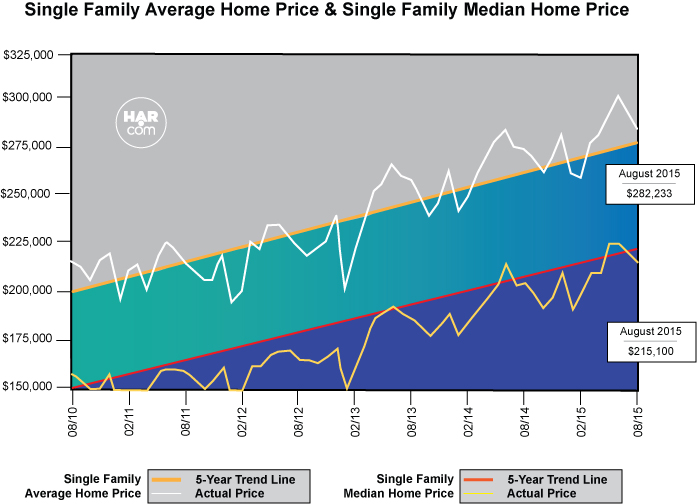
Home prices achieved August highs, with the average price of a single-family home up 2.9 percent year-over-year to $282,233. The median price—the figure at which half the homes sold for more and half for less—rose 4.9 percent to $215,100.
August sales of all property types totaled 8,836 units, flat compared to the same month last year. Total dollar volume edged up 2.6 percent to $2.4 billion.
“The Houston housing market has been robust in 2015, keeping pace with last year’s record-breaking numbers and August turned out to be flat, by and large,” said HAR Chair Nancy Furst with Berkshire Hathaway HomeServices Anderson Properties. “We’ve started seeing signs of more sustainable inventory levels as more new listings come onto the market.”
August Monthly Market ComparisonThe Houston housing market yielded comparable results in the August 2015 versus August 2014 analysis, with single-family home sales up fractionally, total property sales flat, total dollar volume up slightly, and prices reaching record highs for an August.
Month-end pending sales for single-family homes totaled 7,413, a 1.5 percent decline from a year earlier. Active listings, or the number of available properties, at the end of August rose 15.3 percent to 34,089.
Houston’s housing inventory held its own in August, reaching a 3.5-months supply versus the 3.0-months supply of one year earlier. That remains below the current national supply of homes which stands at a 4.8-months supply, according to the National Association of Realtors (NAR).
CATEGORIES AUGUST 2014 AUGUST 2015 CHANGE Total property sales 8,838 8,836 0.0% Total dollar volume $2,293,946,040 $2,354,729,681 2.6% Total active listings 29,574 34,089 15.3% Single-family home sales 7,407 7,454 0.6% Single-family average sales price $274,302 $282,233 2.9% Single-family median sales price $205,000 $215,100 4.9% Single-family months inventory* 3.0 3.5 18.4% Single-family pending sales** 7,525 7,413 -1.5% * Months inventory estimates the number of months it will take to deplete current active inventory based on the prior 12 months sales activity. This figure is representative of the single-family homes market.
** Effective May 2015, in an effort to be consistent with industry standards, the Houston MLS is now including all categories of pending sales in its reporting. Previously, the Houston MLS did not include “option pending” and “pending continue to show” listings in its reporting of pending sales. The new methodology is now all-inclusive for listings that went under contract during the month.
Single-Family Homes Update
Single-family home sales totaled 7,454 in August, a fractional increase of 0.6 percent from August 2014. Home prices reached the highest levels ever for an August in Houston. The single-family average price rose 2.9 percent from last year to $282,233 and the median price jumped 4.9 percent year-over-year to $215,100. The average number of days it took to sell a home, or Days on Market (DOM), was 45 in August, where it has held for the past three months
Single-family home sales tracked on a year-to-date basis were flat in August at 50,532.
Broken out by housing segment, August sales performed as follows:
- $1 – $79,999: decreased 8.9 percent
- $80,000 – $149,999: decreased 20.1 percent
- $150,000 – $249,999: increased 9.1 percent
- $250,000 – $499,999: increased 5.3 percent
- $500,000 and above: increased 1.8 percent
HAR also breaks out the sales figures for existing single-family homes. Existing home sales totaled 6,532 in August. That is down 1.1 percent versus the same month last year. The average sales price climbed 2.0 percent year-over-year to $265,375 while the median sales price rose 4.2 percent to $200,000.
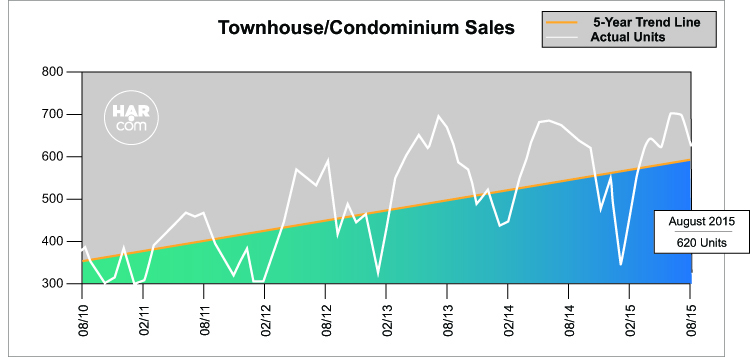
Townhouse/Condominium UpdateSales of townhouses and condominiums slipped 4.0 percent in August. A total of 620 units sold compared to 646 properties in August 2014. The average price, however, edged up 0.8 percent to $197,091 and the median price increased 4.7 percent to $149,000. Inventory grew from a 2.6-months supply to 3.1 months.
Lease Property UpdateDemand for single-family lease homes rose 4.5 percent in August. The average rent for such properties climbed 3.8 percent to $1,901. Townhouse/condominiums leases were up 10.0 percent in August with their average rent up 4.2 percent to $1,647.
Houston Real Estate Milestones in August
- Single-family home sales edged up a fractional 0.6 percent versus August 2014;
- Total property sales were flat year-over-year at 8,836 units;
- Total dollar volume increased 2.6 percent to $2.4 billion;
- At $282,233, the single-family home average price reached a record high for an August;
- At $215,100, the single-family home median price also achieved a record August high;
- Single-family homes months of inventory climbed to a 3.5-months supply;
- Single family home leases were up 4.5 percent while townhome/condominium leases rose 10.0 percent with average rents up year-over-year.


