I’d like to say I am surprised but I’m sadly not.
It’s been awhile since Mr. Hudson came on my radar for something like this. For those not long time readers, back in the $GGP days we had a bit of an exchange when Simon was trying to purchase GGP. Here is the first piece on it and then the second…
This brings us up to date on today….
Mr. Hudson co-authored this piece in which they paint a very bleak picture of the Houston housing market.
As in the GGP days, they make some fatal flaws.
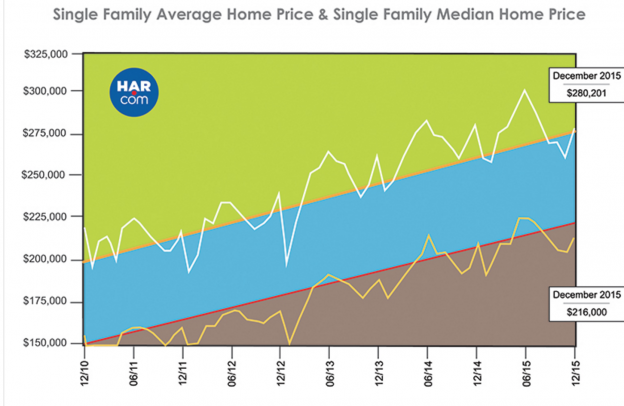
Overall, the area’s average single-family home price was down about 7.5% to just over $280,200 in December from its June record high, according to the Houston Association of Realtors.
Sounds ominous, no?
We should now introduce a little concept called “seasonality”. Real estate is a very seasonal business with price peaking and troughing generally the same time every year. For that reason, one needs to compare prices at the same time of the year in order for the comps to mean anything. Anyone who has covered real estate for more than an afternoon knows this which means the folks at the WSJ must have simply chose to use a comp they knew was meaningless.
Sad….
Let’s look at Houston:
What is the first thing you notice? The home prices in Houston peak every June and bottom……when?????? In December of course….
Geez….who would have thought that those dates would match up perfectly with the skewed comps the WSJ tried to make….. *raises hand*
If you want to make a comp for this that actually means something (vs twist data for an erroneous story) you’d see this (compare the same month YOY):
In December, the single-family home average price dipped a fractional 0.6 percent year-over-year to $280,201 while the median price—the figure at which half of the homes sold for more and half sold for less—rose 2.9 percent to $216,000. The median figure represents an all-time high for a December in Houston
Oh, well, that is more than a bit different.
More actually data that can legitimately be used for comps:
- Days on market (amount of time it takes for a house to sell) exploded up to 57 days….from 56
- Inventory rose to 3.2mos from 2.5mos (6 mos is considered equilibrium for a housing market). 2.5mos was an all time low for inventory.
- Home sales between $150k-$500k were flat for year. The declines were only at the high and low end of the price spectrum
The WSJ also cherry picks some data. For instance they state:
Home-construction permits in the area plunged 26% from a year earlier in the third quarter,
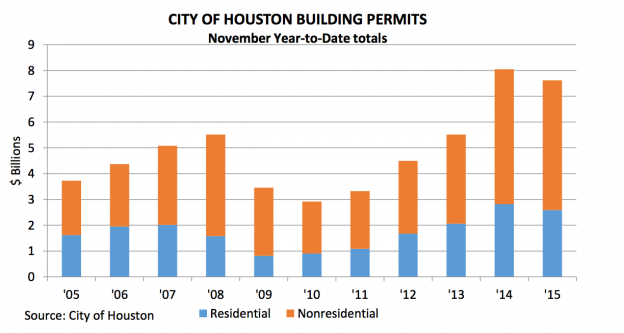
Why just Q3? Does the rest of the year or the months after September not matter? Well, if we look through November (it is the latest data available after all) we see that single family housing permits YTD are down only 2.1% YTD. If we include all types of residential construction we find an 8% decrease, not nearly as draconian as the 26% number they throw at you. You’ll also note that even with this “fall” residential permits are at the second highest level ever….
Then this:
The first sign of trouble came in mid-2014, when oil prices began their decline. Houston’s home sales managed to sustain their momentum until this past summer,
Actually 2014 was the single best year in the history of the Houston housing market and it ended with a record December.
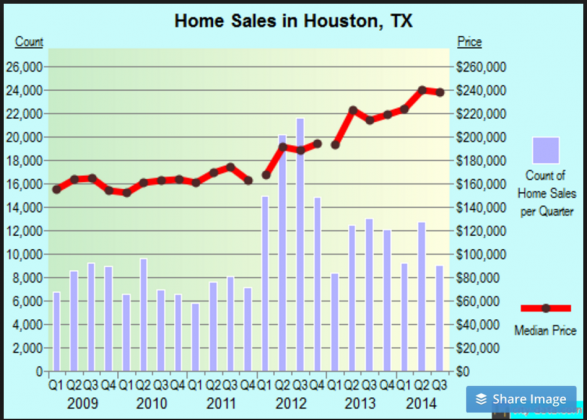
Some perspective is needed here. Houston has been setting sales and price records annually for the last 5 years (see below). It can’t go on forever. It has to pause. A housing market cannot see double digit home price increases infinitely, it isn’t healthy.
Is the Houston housing market slowing down? Sure. However, it is far from in trouble like the WSJ article would suggest. In fact, housing inventory numbers at 3.2mos, are lower than the national average (5.7 months). Far from there being neighborhoods of vacant home sitting around as Hudson implies, the supply/demand equation in Houston is still very tight (that is why price continues to go up). The fact is the typical seller in Houston is having it take one day longer than it took a year ago to sell their home and they are selling it at or above what he could have sold it for in 2014. I’m not sure how this equates to the dire tone of the article?
Sure, did a potential seller that lost their job tell someone to “just make an offer”? I’m sure they did just like they would in any community across the nation and I am pretty sure you can find examples like that in every market. The problem here is that is not the norm, it is an outlier (as all the data alludes to) and once again they try to give us the impression it is what a typical buyer can expect a seller to say.
Are builders beefing up incentives? Sure but again, it is time to point out this is after a half decade of essentially zero incentives. Simply put the market is normalizing.
So, what will it take? At >$75 oil the Houston housing market is again off to the races. With only 3mos inventory it won’t take much to get the market really juiced again (10% annual price gains). At $50 oil Houston’s housing market will still perform at or above the national average (4%-6%) in terms of price gains. $20 will hurt (assuming it stays here for a prolonged period (1 yr)) but it will not collapse the market.
Real estate is one of those topics where it is very easy to cherry pick data to guide the reader to come to whatever conclusion you want them to come to….
One would think certain publications are above that…..sadly they are not.
The Actual Report:
THE HOUSTON REAL ESTATE MARKET ENDS 2015 WITH THE SECOND-HIGHEST SALES VOLUME OF ALL TIME
HOUSTON — (January 13, 2016) — Houston real estate faced a stiff challenge in 2015. It followed the best year on record for home sales. Add plunging oil prices and the resulting layoffs into the mix along with persistently low levels of housing inventory, and the result was the drop in sales that economists had forecast. While there were single-digit declines in sales volume at different times throughout the year, more substantial ones struck during the fourth quarter, including December. Nonetheless, the total number of 2015 single-family home sales as well as sales of all property types achieved the second-highest levels of all time, behind 2014.
December single-family home sales slid 9.7 percent versus December 2014 while total property sales dropped 9.9 percent. The latest monthly report prepared by the Houston Association of Realtors (HAR) shows a total of 5,879 single-family home sales compared to 6,507 a year earlier. The sales slowdown did allow inventory to grow from a 2.5-months supply, the lowest level of all time, to 3.2 months. Homes priced between $150,000 and $500,000 saw flat year-over-year sales, while homes below $150,000 and above $500,000 experienced declines.
“With oil dropping to levels around $30 a barrel, I think it’s fair to say that the Houston housing market is going to remain cooler for at least a little while,” said HAR Chairman Mario Arriaga with First Group. “The good news is the local economy is vastly more diversified than it was during the oil bust of the 80s and other industries are continuing to hire, so it really is going to come down to consumer confidence.”
A year ago, Houstonians were hailing a surge in employment that drew home buyers and renters from across the U.S. and around the world. By contrast, the latest Texas Workforce Commission report states that the Houston metro area added just 4,800 jobs in November, making it the third weakest November in 25 years, according to the Greater Houston Partnership, which notes that the region typically adds 10,000 to 12,000 jobs in the month.
In December, the single-family home average price dipped a fractional 0.6 percent year-over-year to $280,201 while the median price—the figure at which half of the homes sold for more and half sold for less—rose 2.9 percent to $216,000. The median figure represents an all-time high for a December in Houston.


