When we woke up this morning we were under the impression that November housing starts were at a 1.1M seasonally adjusted annual rate. The number for December then came in at 1.1M….essentially flat.
Now, we then got word that November was being revised up massively to a 1.8M annual pace and somehow we then made the jump that today’s number was bad because starts “fell”? We added a 700k home start annual pace to the aggregate number in November and December and this is bad? We should not that the 1.8M number is the highest November number since before the Great Recession.
Think of it the other way. If November was revised DOWN to 800k and December came in at today’s 1.1M would we be cheering this as good news because starts “rose”? Sadly I think yes, OR, it again would be bad news because of the downward revision. The point here is people are finding bad news out there where there isn’t any.
U.S. housing starts and permits fell in December after hefty gains the prior month, adding to a raft of weak data that have raised concerns over the health of the economy.
Groundbreaking dropped 2.5 percent to a seasonally adjusted annual pace of 1.15 million units, the Commerce Department said on Wednesday. November’s starts were revised to a 1.8 million-unit rate from the previously reported 1.17 million-unit pace.
December was the ninth straight month that starts were above 1 million units, the longest run since 2007. Housing starts averaged 1.11 million units in 2015, the highest since 2007 and up from 1.00 million units in 2014.
Building permits fell 3.9 percent a 1.23 million-unit rate last month. The drop followed two months of hefty gains.
The WSJ actually has a great informational page here where you can see the numbers and not that 2015 was way ahead of 2014 and November and December blew away 2014. In other words, housing maintains its positive momentum heading into 2016.
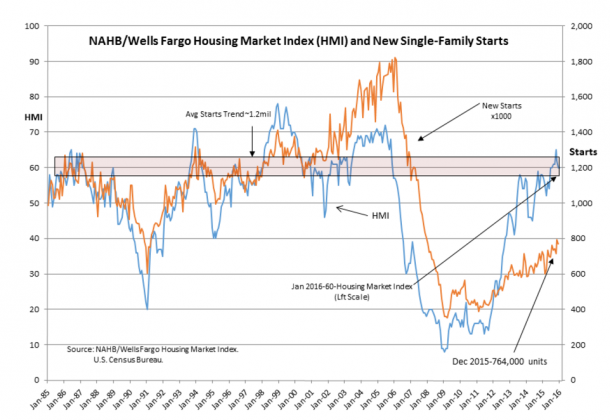
Here is “Davidson’s” chart:
The trajectory of the US housing market is clear.
