“Davidson” submits:
Light Weight Vehicle Sales, Help Wanted Online, Household Employment, US Real GDP and PCE Trimmed Mean Inflation were reported this week. All continue to signal economic expansion. Yet, fears of major bankruptcies in the energy sector, collapse of oil based economies and even rampant fear of European bank failures early this week were media headlines as these economic reports were released. Early 2014 to early 2016 has been a period of ‘mind over matter’. It has been what has become of market psychology excessively skewing market prices. Investors witnessed extreme US$ strength as a select group of ‘hyper-inflation believers’ realized that their bet against the US$ was wrong. In 2014 markets forced them to reverse. This reversal took US Treasury rates much lower and collapsed commodity prices which in turn panicked them even more. Now that the US$, which had shifted to extreme levels of strength, is reversing back to its long term trade weighted trend, oil is rising as are all commodity prices and fears of global collapse are evaporating. Market psychology is like a wisp of smoke. It is there and then it is gone. Panic is like that! The fact is panic usually goes to such excess that people suddenly recognize that what they feared was simply wrong! Just as many say the “cure to low prices is low prices”, the cure to panic is too much panic. We just had too much panic! Too much panic suddenly triggers common sense! Market psychology is like that. It can turn on a dime.
Market psychology is dominated by trend followers. Since 1995, trend followers have operated through Hedge Funds (HF) with high levels of leverage. HFs can lever positions as much as 50:1 in currency trades. Being so levered, they must be responsive to every price tweak and they must adjust nearly instantaneously to prevent disastrous losses. There is currently ~$3tril in HFs and ~$100tril in global financial assets. Levered at 10:1, $3tril becomes $30tril which needs to shift quickly to capture profits in perceived trends. HFs are heavy users of computers to detect price trends. HFs cause their own price trends or changes in trends. There is much short term movement caused by HFs shifting assets quickly. I think the impact of their own actions tends to be lost on them. They push something in one direction, it goes in that direction and they say, “Oh, my God, its moving, we better do some more.” It is like a hungry snake seeing what it thinks is prey in a maze of grass and attacking it. It does not realize that it is its own tail. Picture a snake eating its own tail!. History is replete with examples of investors being deceived by their own actions because all they used as a basis for investment decisions were price trends.
Some may remember ‘Bucky’ Hunt’s and his brother’s attempt to corner the silver market 1979-1980. https://en.wikipedia.org/wiki/Silver_ThursdaySilver Thursday was an event that occurred in the United States in the silver markets on Thursday, March 27, 1980. Nelson Bunker Hunt and William Herbert Hunt attempted to corner the market in silver. In 1979, the price for silver jumped from $6 per troy ounce to a record high of $48.70 per troy ounce, which represented an increase of 712%. The brothers were estimated to hold one third of the entire world supply of silver (other than that held by governments). They kept buying silver believing that it was becoming scarce and in high demand. What they did not realize was that the price trend driving their investment decisions was really their own buying. While they thought it was the ‘market’, they completely missed the fact that it was they who were the market. Silver fell 50% in 4 days once they stopped buying after realizing their mistake. They had been the only buyers in pool of sellers. There was no one for them to sell to. HFs with ~$3tril and high leverage are like the Hunts in 1979, the Jesse Livermore’s of the early 1900s and hundreds of examples throughout global financial history. HF trend followers get trapped just this way today, but they run highly levered ~$3tril. With markets being so much more volatile, investors need tools to guide them through this activity. Those tools are economic data and long term thinking.
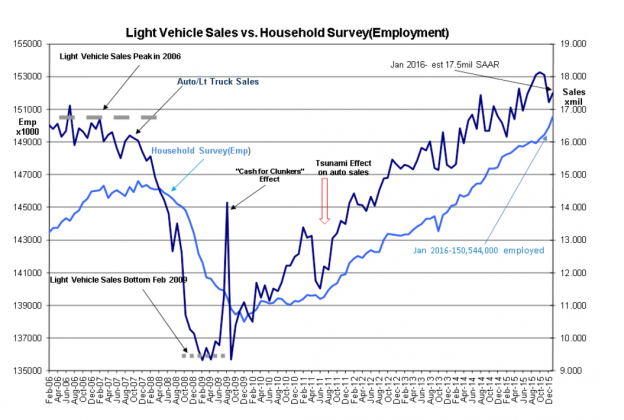
Vehicle Sales and Household Employment reported this week continue to reflect steadiness in the US economic expansion. This morning’s Household report indicated a rise of 615,000 in employment. These results are derived statistically with a 436,000+/- error or 0.3% on 150,544,000. 615,000 is likely too high and will likely be corrected in future reports, but it signals that the up trend continues. Good news!
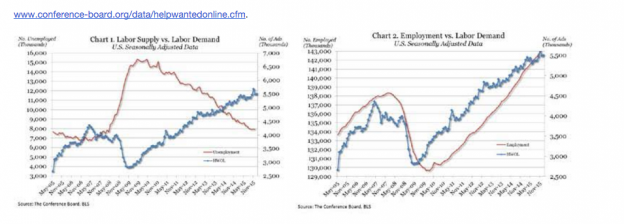
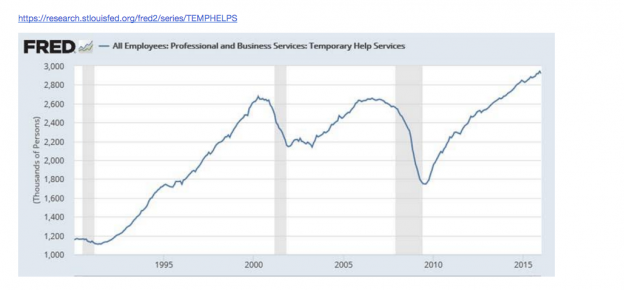
The Conference Board reported its Help Wanted Online as up slightly in Jan 2016, but again there is statistical variability and the up-trend persists. The BLS reported its Temporary Help Services remains in an up trend. Demand for labor continues at record levels. Good news!
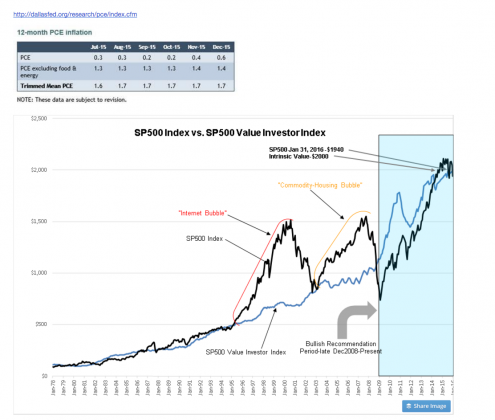
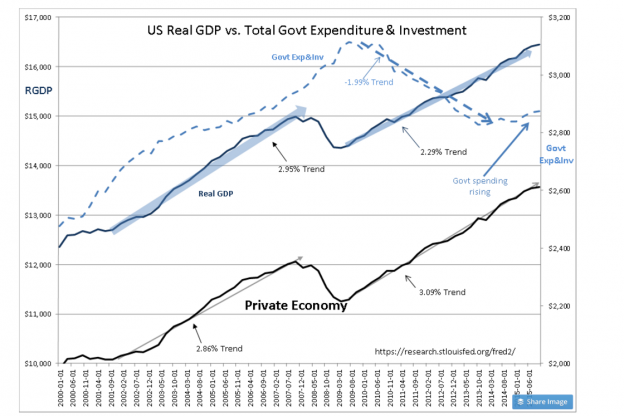
The Dallas Fed reported PCE Trimmed Mean inflation measure at 1.7% which has been flat due to government spending having fallen the past 5yrs. The SP500 Value Investor Index today at $2,000 shows the SP500 to be at levels attractive to Value Investors. There are many media reports of Value Investor buying depressed shares. Corporate insiders are doing the same for those who want to look. A good site for this information is http://openinsider.com/
This economic expansion has been accompanied by falling government spending which creates a relatively low inflation climate. Good news!
Last and of less importance is US Real GDP and the Private Economy. This is a report which lags by 6mos and not overly useful for determining investment market lows and peaks. Where it is useful is in understanding our ‘Top-Down” economic situation. The Private Economy is derived by subtracting Govt Exp&Inv from Real GDP. By doing so it is easier to determine the growth of the current US recovery vs. past recoveries. It is. This is more good news!
Previous notes have shown the correlation between Govt Exp&Inv and inflation. The decline in Govt Exp&Inv has resulted in many misinterpreting gross economic trends such as GDP, Hourly Wage Growth and etc each of which requires adjustments to inflation to understand their trends. The focus on GDP vs prior periods of which Govt Exp&Inv represent 17-18% currently misses the underlying strength in the Private Economy. One must dive deeper into the information to understand current conditions. Likewise, looking only at Gross Wage Growth which in the past was inflated by inflation and comparing to today’s numbers misses the point that inflation adjusted Real Wage Growth is the same today as it has been in the past. Good news!
Crucially, what these economic charts tell us is that the overly pessimistic market psychology is simply wrong. Price trends do not determine economic activity. Those who trade markets with the aid of computers and use high levels of leverage are short term traders. Their only focus is short term price trends because the combination of leverage and being wrong on the price trend can negatively impact portfolios in the blink of an eye. Economic charts let Value Investors, who are long term holders, look through current market psychology and to buy when prices are low when economics are trending positively or oppositely to sell when prices are high when economics are trending negatively.
I am a Value Investor. I have remained very positive during this long period of pessimism because the economic activity remained positive. This is how Value Investors take advantage of market psychology. Today’s US$ weakness is reversing the market psychology of the past 2yrs. I expect to see commodity prices recover. I expect to see Intl LgCap equity prices to rise to new all time highs as the US$ shifts back to long term trend. Contact me if you would like to see my note describing the economics of the long term US$ vs. Global currencies and World GDP.
Panics end when the news continues to be too good for common sense to ignore. It is impossible to predict when or what direction market psychology will take. One can see it happening, but not predict it. One has to invest through it using economics. Time to be very bullish!! Lots of good news!!
