“Davidson” submits:
Retail and Food Service Sales were reported today. Retail Sales are a measure of the heart of our economic activity and the financial health of individuals. Retail and Food Service Sales are at the highest levels ever measured and trending higher. Would you believe that today’s pace is more than 35% higher than our last recovery. Comments in the media would lead you to believe otherwise. Perhaps you have heard a number of recession forecasts. I have heard at least a dozen well known investors say a recession will occur before this year is out. My view differs considerably and remains very positive.
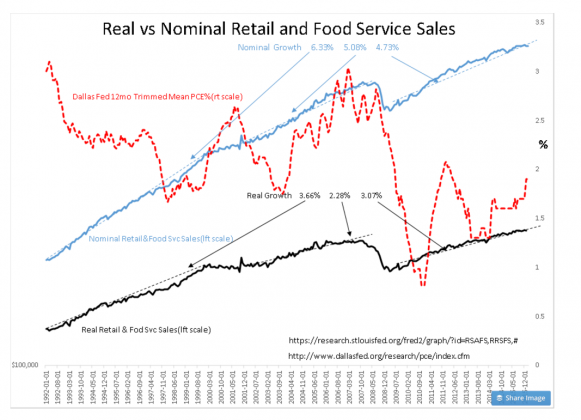
It is my opinion that many confuse Nominal and Real economic data. To explain the differences and to underline the reasons why I think remaining positive is the best stance for investors, I ask you to consider the chart Real vs. Nominal Retail and Food Service Sales. The term “Nominal” refers to the sales as reported and Nominal Retail&Food Svc Sales are shown by the LIGHT BLUE LINE with trends shown by the LIGHT BLUE DASHED LINES. The term “Real” refers to sales which have been adjusted for inflation which lets us analytically compare past sales levels with current levels which cnnot be done with Nominal data. Real Retail&Food Svc Sales are shown by the BLACK LINES with trends shown by the BLACK DASHED LINES. Inflation is represented by the Dallas Fed’s 12mo Trimmed Mean PCE and shown by the RED DASHED LINE.
The only way to compare economic measures based on prices is to adjust the reported values for inflation. Not only is this required for retail sales but it is required for wage growth, Gross Domestic Product, personal income and any economic measure which includes price as a component and where we compare past periods with current periods to gauge economic performance. Many economic measures are counts and do not require inflation adjustment. A count measures how much of something is produced or is available. This includes how many people are working, how large is our population, how many vehicles are sold, how many homes of a certain type are built and sold and etc. None of these measures can be precise but they do provide useful data in assessing how we are doing economically. In addition, it is never a particular data point change month to month which provided useful information. It is always the trend over time, usually longer than 6mos, ‘the current trend’, which is compared to trends for similar or even longer periods in past periods which offer the greatest economic insight. With these considerations in mind the Real vs. Nominal Retail and Food Service Sales chart is revealing.
The chart shows 3 trend periods spanning 1992-Present. See the table: Comparison of Nominal vs. Real Retail&Food Svc Sales
Table: Comparison of Nominal vs. Real Retail&Food Svc Sales Growth Rates
Period 1992-2000 2002-2007 2009-2015
Nominal % 6.33% 5.08% 4.73%
Real % 3.66% 2.28% 3.07%
Avg Inflation % 2.67% 2.80% 1.66%
The current pace of retail sales with a nominal rate of 4.73% (which many moan as well below that of past recoveries) is when adjusted for inflation ~35% higher pace than our last recovery and only ~15% below the retail sales reported during the 1990’s ‘Internet Bubble’. The differences between Nominal and Real data is inflation which rose with the rise in US military spending 2002-2007 and fell as military spending fell 2009-2015. Real Retail&Food Svc Sales data series is only one of many economic indicators (adjusted for inflation where necessary) which reflect very positive economic trends today. The ‘Doom and Gloom’ crowd in my opinion simply do not know how look at economic data. I hope this explanation helps you to understand the investment environment today.
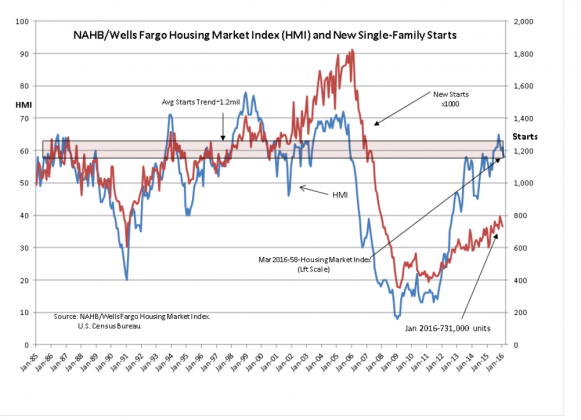
The one major sector clearly lagging in our current economy is the Single-Family Home sector. The NAHB Housing Market Index was reported today at 58. While at historically positive levels, the HMI compared to Single-Family Starts reveal that we are woefully behind the historical ~1.2mil average many consider necessary to house our population. The housing sector while growing is not at the pace seen historically.
No two recoveries are ever alike. One never knows exactly how regulatory changes or Fed action is likely to shift investor behavior. In general a rising economy does lift equity prices. Eventually, investor psychology shifts from pessimism to optimism. Having almost 35yrs of investment experience and having been associated with 3 major Wall Street firms and known more than a few of the ‘best and brightest’, I learned (at times painfully) that market prices are far more reflections of investor psychology than actual values. Prices are impossible to predict. We just experienced a major swoon due to fears that falling energy prices would collapse the global economy in a ‘deflationary spiral’. For several years before that the fear was ‘hyper-inflation’ due to Fed Quantitative Easing. A simple look at the inflation trend in the chart reveals that neither actually occurred. Inflation averaged 1.66% for the period. This truly demonstrates how market psychology can have periods during which investor logic is completely missing. It is why they call it “Market Psychology”. Investors need to be able to tell the difference between “Value” and “Market Psychology”.
It appears that inflation may be rising with the most recent reading of 1.9%. I attribute this to increased government spending. Rising inflation will push higher all economic measures based on price. This in my opinion will cause those who do not adjust for inflation to believe we are having economic acceleration. They will see higher earnings, higher wages and other increases as ‘increased demand’ when it is only inflation. In the past this has stimulated investors to sell bonds and buy equities. I expect to see the same in the current cycle.
How high? I cannot tell! How long? My best guess is that economic activity still has several years to run. I expect we will see the early signals of economic stagnation well before the market responds. If you are able, I recommend that investors add to equities to take advantage of low prices.

