“Davidson” submits:
Your ‘Numbers Sense’ matters in the perception of economic growth. Growth has been and is far better than most believe. Real GDP was reported as revised higher from 3.2% growth to 3.5% growth for fiscal 3Q2016(ending June 2016). How this is interpreted, becomes the basis for economic and investment forecasts. Many have perceived US economic growth since the 2009 recession ended as being a whisper above recession. There have been many recession predictions and market collapses. Too many to count!. The economy has grown persistently every year since with steady rises in Real Personal Income, Retail&Food Service Sales and Vehicle Sales. The pessimism till the recent Presidential election has been palpable. Many accept GDP measures without going deeper into the details. It is in the details where your ‘Numbers Sense’ is refined.
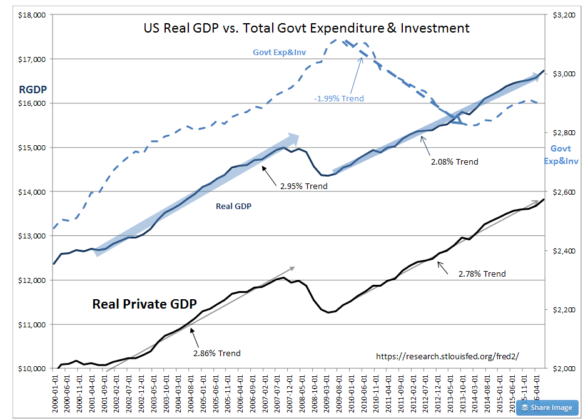
Numbers Sense means knowing what various economic measures specifically represent. Does a particular economic measure capture the specific data one thinks it does? This is the question one needs to ask to be sure one’s perception is in line with the factual evidence. GDP is one such measure which is a composite and has created great confusion. GDP has long been accepted as the primary measure of US economic activity. Yes, it does measure gross output, but does it in fact measure economic activity in a way that is useful. Two major streams of consumption in any economy are that which represents the native population and exports and that which represents government spending. Government is not a producer. It is a consumer of Private GDP output and relies on taxation and borrowing to generate the cash flow to operate. It is Private GDP which provides the sole support for Government spending. The issue arises when Government spending is uneven which may distort GDP causing forecasters to misinterpret underlying economic activity. Subtracting the measure Real Government Expenditure& Investment out of Real GDP provides the value Real Private GDP. While no economic measure is perfect, the difference between Real GDP and Real Private GDP explains much of the confusion with economic forecasting and reality. LOL, the current economy is growing in line with the historical trend with ~2.8% today.
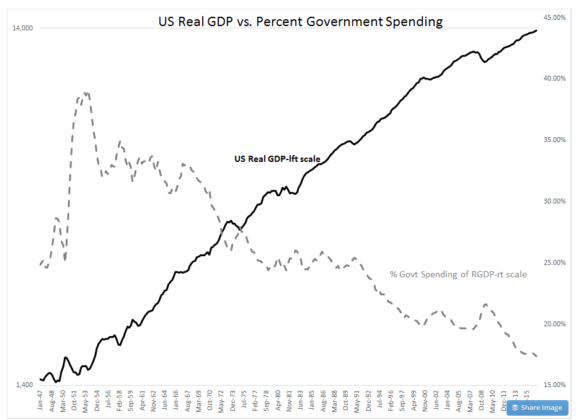
To gain perspective on the concept of the Real Private GDP, it is useful to review some history. Real Government Expenditure& Investment does not include transfer payments which comprise the bulk of the US Government Budget. Real Government Expenditure& Investment rises and falls with significant government programs, i.e. WWII, Korean War, Interstate Highway System, Vietnam, NASA Man on the Moon, “The Great Society”, “Star Wars” spending and etc. These are all Real Government Expenditure& Investment programs that impacted economic activity over the years. The history of Real Government Expenditure& Investment as a percentage of Real GDP shows how greatly Government spending has impacted this economic measure. Today, Real Government Expenditure& Investment at 17.38% is at its historic lowest level. The decline in Real Government Expenditure& Investment since 2009 has impacted the measurement for GDP and caused many forecasters to be overly pessimistic and confused about economic activity.
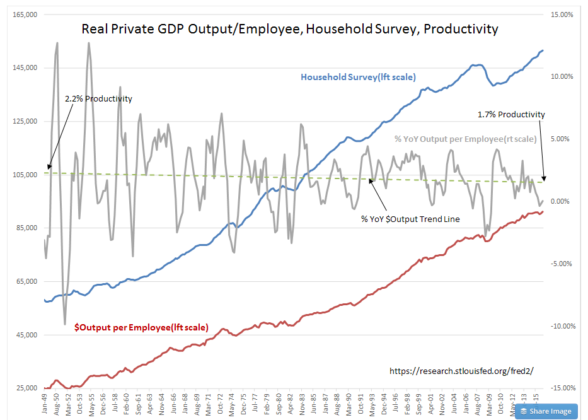
When Real Private GDP is applied to Productivity measurement, the pessimistic outlook of the US economy fades away. The Productivity trend, based on Real Private GDP, averaged 2.2% in 1949 and has gradually drifted lower to 1.7% today. Today economic activity has mostly remained in line with this trend. The recent decline in Productivity comes from recent US$ strength. Note that the Real $Output per Employee has climbed steadily since 1949.
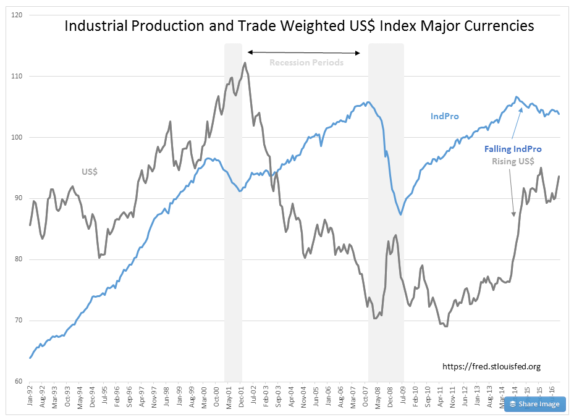
That US$ strength has impacted Productivity can be seen in the recent inverse correlation between IndPro and the Trade Weighted US$ Index Major Currencies. We have experienced an industrial recession with substantial reduction in employment 2015-2016 in our energy and high-value export industrial sectors. The evidence suggests adjustments have occurred and that the US$ has likely peaked with improvements to US IndPro to follow. A falling US$ will greatly improve Productivity by making US high-value exports more attractive globally.
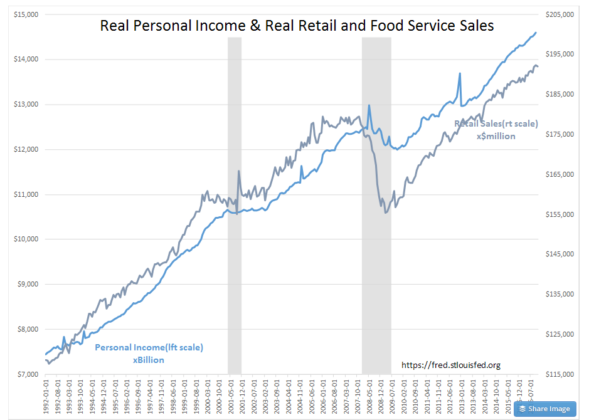
The greatest mismatch between past very pessimistic forecasts of GDP growth and other economic measures comes from the growth in Real Personal Income and Real Retail&Food Service Sales. It is inconceivable to have a weakly growing economy coupled with the enormous strength in these two crucially important indicators of economic health. There has been a myopic focus on month-over-month change while the strength of the long-term trend has been almost completely ignored. In the confusion of what to trust, most forecasters have relied solely on Real GDP and ignored conflicting information. That these consumer pocketbook measures correlate well with the Real Private GDP confirm that Real Private GDP is a better measure than Real GDP when it comes to any economy.
The question remains. What is your ‘Numbers Sense’?
If one views economic activity using Real Private GDP, then much of the confusion between GDP and other economic measures is explained. Your investment position today should be bullish. Your investment position should remain bullish till the US$ normalizes(US$ is the ‘elephant in the room’). It is my estimate that this should occur slowly over the next 5yrs or so and prove beneficial for US and global growth.
Economic activity is much better than many believe today. The next several years appear to offer considerable opportunity for investors.
