“Davidson” submits:
Beware of overly simplistic thinking. Beware of analysts who comment on every wiggle of economic data when the ‘wiggles’ are meaningless artifacts of economic measurement.
A driver of much investment analysis is the belief that markets act rationally and if the price of something changes, it must be due to supply/demand changes. Falling prices mean either too little demand or too much supply and rising prices mirror the reverse. Falling oil prices since mid-2014 have been met with this universally accepted perception. Oil prices rising or falling with each weekly report have been met with commentary that inventories were either higher or lower than expected which justifies an intense period of rapid buying or selling. Track a series of weekly reports and one quickly comes to see that that consensus opinion flips Bullish/Bearish so often that makes investors wonder where any common sense resides with these ‘experts’.
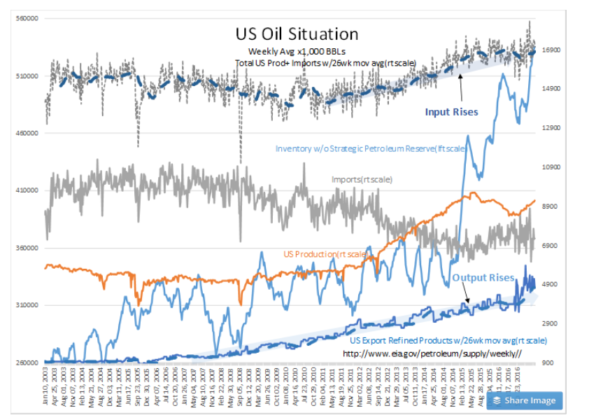
It is useful to view the US Oil Situation from Jan 2003, a long enough period to understand the context of market commentary vs. actual trends. First to note is that US Inventories excluding the Strategic Petroleum Reserve is estimated today ~530mil BBL. This has an apparent measurement error of at least +/- 2mil BBL/week, but is likely much larger one reads about all the sources which enter the estimates. When analysts comment on fluctuations of 1-2mil BBL vs. expectations on a particular week’s report as important, investors should recognize that it is impossible to forecast weekly levels with that degree of certainty. There are two reports each week. The American Petroleum Institute (API) estimate is generally released Tuesday after the market closes with the Energy Information Admin(EIA) report the following day at 10:30AM. It is interesting that the API and EIA reports often differ by 2mil BBLs (but have differed by ~8mil BBL) and in opposite directions. Oddly, analysts and traders respond as if each level is valid. API reports 5.8mil BBL Inv Decline Today’s EIA reported decline of 5.3mil BBL is a very small percentage of 530mil BBL current commercial inventories, i.e. 0.01%. This should be viewed as less than a ‘wiggle’. Again, traders, like clockwork, have traded $WTI higher by $1.45BBL or a 3%-4% price move.
Investors should recognize that as in any economic measure it is the long-term trend which is important. The trend smooths out short-term data-collection dependent fluctuations. With the US Oil Situation data from EIA, one needs to also recognize that seasonal shutdown cycles for winter/summer catalyst change-over and maintenance periods have a dramatic impact on inventory levels which the industry utilizes to ensure smooth supply to consumers. It appears that since mid-2014 the consensus has conflated any inventory increase with the belief excess supply was driving down oil prices. Ignored has been not only the fact that inventories fluctuate by 30-40mil BBL during shutdown periods but have also been rising to a 30day supply vs. refining input recommendation by the EIA and an inventory need to support a huge rise in US Exports of Refined Products. Since 2006, US Exports of Refined Products have risen 550%. Crude inventories have only risen by ~200%.
Where the lack of critical thinking has been is in the mantra “Oil Glut!” heard daily since mid-2014. This becomes obvious when one examines US oil industry inputs/outputs. US Production+Imports enter the refining system and exit as refined products with US Exports Refined Products are a good measure of global demand.. Notably, trends in both inputs and outputs have seen a continuous rise since well before the term “Oil Glut!” became the theme. One should have expected to see a dip in both trends if excess supply required a period of slower output to permit Supply/Demand to come back into balance. There is no such period present in the long-term data. The pattern present is one of the US raising its higher-value exports and associated inventories to take advantage rising global demand.
There is and there has not been any indication in the EIA data trends of excess supply justifying the belief of an “Oil Glut!”
Markets have a long history of conflating meaning to price changes which are not supported by careful analysis. Believing that the Federal Reserve controls interest rates, believing oil or tight labor supply result in inflation and believing that a strong US$ is good for the US economy are part of Wall Street thinking for which the evidence supports the opposite view. The current “Oil Glut!” belief falls into this pattern.
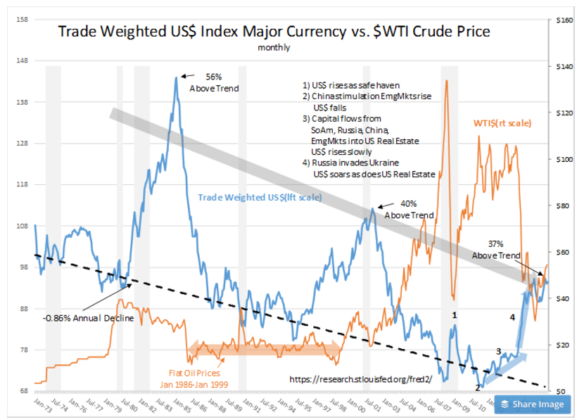
What does correlate to the current oil price decline is the strong US$ 2014-2016. This is a recent correlation which became much stronger after 2003 when Momentum Investors began the wide use of algorithms tying oil prices to the US$ inversely and to recessions directly.
The current evidence of a global economic expansion makes it obvious that weak oil prices are not due to weak demand. Demand is clearly rising and the recent jump in US Exports of Refined Products suggest an acceleration in demand. The more obvious correlation is that to the US$.
The consensus has made its typical error of mistaking falling prices to Demand/Supply. Supply/Demand has not been part of the oil price equation this time as much as prices tied to the US$. US$ strength is cyclic. It occurs when investors pool in the US seeking higher rates of return which occurred last in the early 1980s and the late 1990s. US$ strength lasts for 2yr-3yrs before returns elsewhere attract investors to shift back to foreign markets. Recent performance of Intl Equities indicate that this has been occurring since Feb 2016.
My guestimate is that now that Intl Equities have 12mos of strong performance, we should see more capital shift accordingly. Investor behavior is cyclical. Investors always follow economic momentum once it has become obvious. It is in the normalization of the US$ over the next 5yrs+ that I expect added economic stimulus globally to extend the current economic expansion.

