How can we have a record number of $SPY companies beating sales estimates, record profits and other record economic indicators with an economy growing just over 2%?? Maybe, just maybe, it’s because things aren’t as mediocre as they seem?
“Davidson” submits:
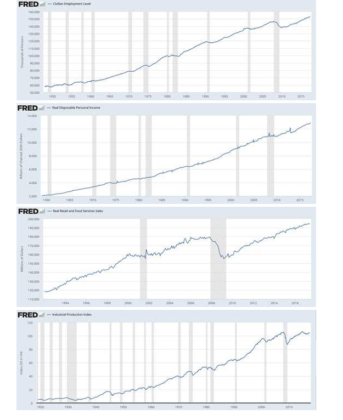
How do we achieve record employment, record earnings, record Personal Income, record Retail Sales, near record Industrial Production and still think that our economy is weak? The economic data from the St. Louis Fed speaks volumes and underscores the strength of the current economic cycle. Then, why the continued gloom?
What is it so many continue to miss? As this series of charts demonstrate, economic activity is as robust as it has ever been since measurement began in the 1940’s. Few believe!
Where are our critical thinking skills? When the body of evidence is overwhelming against the consensus view, it is necessary to locate the fault in the thinking. Investing as a contrarian is where the greatest gains occur over time, but to do so requires careful analysis as to why one’s own view is better. Critical thinking skills are needed when going counter to consensus. This is especially so when it appears that one’s view has so few supporters. Taking this route requires thinking like “The 1% Solution”. That is, thinking in a direction which is very contrary to widely-held opinion and developing the tools necessary to prove one’s analysis. That analysis leads to the concept of the Real Private GDP.
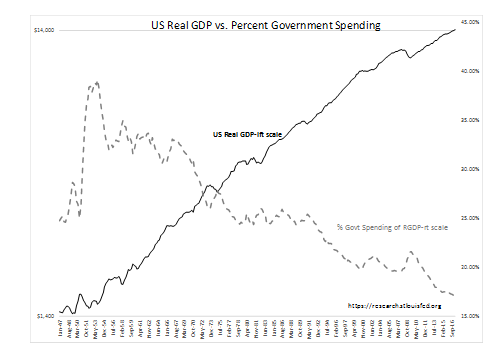
Real Private GDP is the Real GDP minus Government Expenditure&Investment. It has been and continues to be taught that Real GDP measures the output of an economy. That view held by the consensus on the surface appears to be true. The issue which becomes apparent when discussing government stimulation during weak economic periods is the true impact of government spending on output long-term and whether government spending is a useful tool during recessions. It is the John Maynard Keynes vs. Friedrich von Hayek argument which has dominated economics for nearly 100yrs. The chart US Real GDP vs. Percent Government Spending shows that Government Expenditure&Investment is currently at the lowest level of Real GDP in history while Real GDP is at a record level. If one seeks a long-term correlation between Government Expenditure&Investment and Real GDP growth, it will not be found.
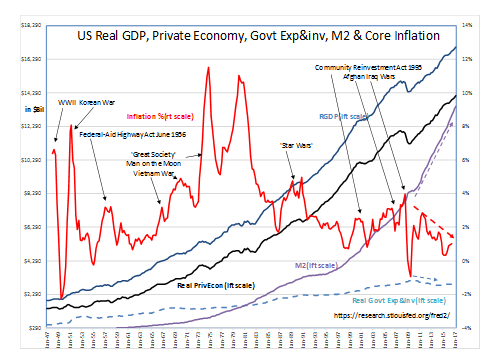
What is found is that during periods of growth of Government Expenditure&investment is that inflation rises. The US Real GDP, Private Economy, Govt Exp&Inv, M2 & Core Inflation chart helps explain this. Government Expenditure&investment occurs via Treasury debt issuance and budget deficit spending. It typically is an ‘immediate need expense’ often a war expense which results in paying more for goods and services than consumers pay. Government spending when executed over a short period results in bursts of inflation. The best example in our history was “the Great Inflation” period. “The Great Inflation’ of the 1970s actually began in 1965 with “The Great Society” spending piled on top of “The Man on the Moon” spending piled on spending for the “Vietnam War”. Pervasive inflation entered spending habits of consumers who greatly expanded the use of debt to preserve spending power. Paul Volcker finally came to the rescue by raising rates to 18% causing a double recession in the early 1980s to stop what threatened to be an inflationary spiral similar to 1930s Germany and Venezuela today. Government had been printing currency to cover its social spending programs without a productive return. Every time government spending accelerates, it causes inflation.
The widely held belief that inflation is strictly a monetary phenomena is not supported by recent history. The current Federal Reserve policy of accelerating M2 with the purpose of accelerating inflation to 2% has not been inflationary. Inflation has actually fallen with the relatively sharp rise in M2 the Fed has engineered through its recent various QE actions. The connection between monetary policy and inflation is disproved. What is going on?
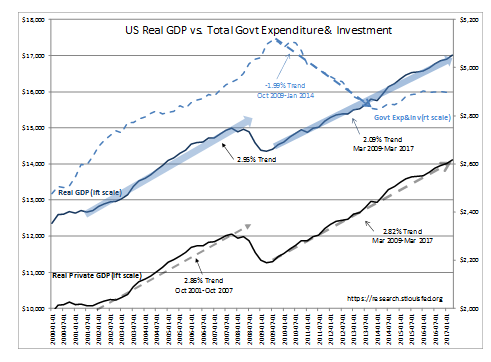
In US Real GDP, Private Economy, Govt Exp&Inv, M2 & Core Inflation the answer can be seen in the Real Govt Exp&Inv trend. As shown in greater detail in US Real GDP vs. Total Govt Expenditure& Investment from Jan 2000-March 2017 What is absent this time has been government spending. Real Govt Exp&Inv spending fell from 2009 at ~2% annually with the reduction of military spending and the Budget Control Act of 2011 or “Sequestration Agreement”. Government spending actually began to decline from its peak Oct 2009 as political party spending disagreements grew. Since Government Expenditure&Investment is included in the GDP measurement, the measurement of US Real GDP reflected less than historic growth at ~2% due government the fall in government spending. The net/net was a GDP perceived to be growing at only 2/3rds of its potential in the view of the consensus. Accepting weak GDP growth as the correct view of our economy, the other measurements have been routinely disregarded or disparaged as accurate with pessimism coloring every economic release.
Critical thinking forces one to eliminate government spending from GDP. Government spending derives its support from the Real Private GDP. The Real Private GDP is found by subtracting Govt Expenditure& Investment from US GDP. Doing so leads to an internally consistent view of the current US economic cycle. We are experiencing typical growth in multiple economic indicators because the underlying Real Private Economy is growing at or close to its historical rate. If one calculates Productivity using Real Private GDP, this measure is also on its historical trend. The pessimistic consensus needs a dose of critical thinking. The Real Private GDP at 2.82% is ~40% higher than the Real GDP.
Summary:
The true measure of the US economy is the Private GDP. Government spending has been conflated into GDP and often skews true economic conditions. Government spending is the chief source of inflation not monetary policy. The Real Private GDP is the only measure which is internally consistent with other economic indicators. The Real Private GDP tells us the current economy is in line with the historical trend. Consensus pessimism provides a highly misleading view of current economic conditions.
GDP measurements are only useful for telling us where we have been. GDP does not predict the future. Other indicators are far more useful forecasting the likely direction of economic activity. The current pace of many indicators support higher prices for equities and lower prices for fixed income.
Investors if they take away any lessons is that the consensus is always wrong and the best one can do is to forecast higher or lower prices but specific price forecasts are impossible.


