“Davidson” submits:
There is one group which believes rising rates are bad for economic activity while another group believes they signal economic strength. Both groups miss the key ingredient of the rate impact on economic activity. The key to understanding the interest rate impact on economic activity has 2 parts. The 1st part comes from understanding the rate spread between short-term capital vs. long-term capital. The 2nd part comes from having a long-term investment focus as opposed to a short-term trading focus. The reason I write about the short-term/long-term so often is because the media’s daily focus is nearly exclusively short-term with one current event (or another) threatening one collapse (or another) when none of these events seem to have any long-term impact whatsoever.
When I began my career in the early 1980s, Wall Street’s historical commission schedule had recently collapsed and firms had already begun to focus on adjusting research towards a higher level of trading activity to make up for the prior less-frequent-but-much-higher-commissions era that had lasted 183yrs. Jason Zweig wrote a good piece on what is called “May Day” The focus then as now was directed towards a higher pace of short-term trading to generate revenue on smaller commissions. It was a transition period which today has devolved into “High Frequency Trading” by computer algorithms. Most investors and advisors have been bitten by the short-term trading focus. ‘Short-termism’ was ideal for development of an entire media industry. The short-term media focus makes for exciting daily entertainment much like any written for TV serial cliff-hangers, but it is highly misleading for investors seeking decent portfolio gains over the investment cycle. Investment cycles today can last more than 10yrs. Short-term trading advice the media promotes is simply inappropriate for investors.
Even though I monitor markets and economic trends daily, my investment focus is long-term and on the current investment cycle. Typical holding periods for mutual funds have been the length of the current cycle and have been dependent only on valuation or manager performance. My opinion has remained positive since early 2009. For individual issues, I have recommended taking gains when it appeared that market forces had driven prices to excessive levels relative to financials or resulted in a portfolio imbalance. At the moment, conditions appear to support rising equity markets for several years and I recommend investors continue to add capital to Equities as having favorable risk/returns while avoiding Fixed Income which has unfavorable risk/returns.
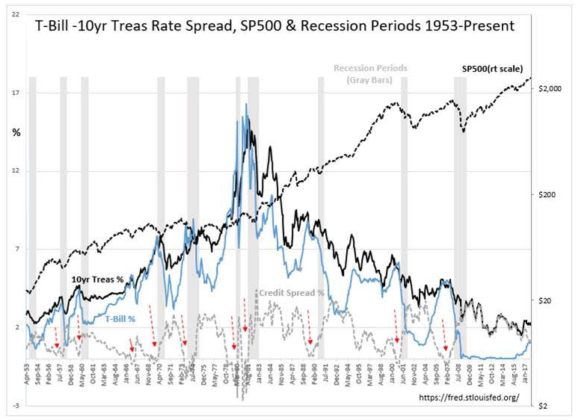
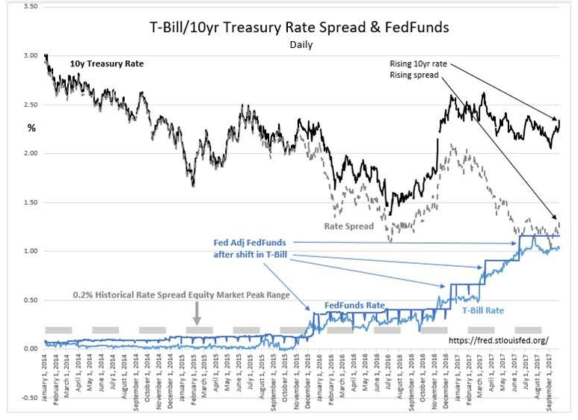
One of the keys to long-term investing on which Wall Street seems to have lost its understanding is the relationship between short-term vs. long-term rates. Even with the many changes which have occurred in banking regulations the past 70yrs, the rate spread between the T-Bill and the 10yr Treasury Note still represents one of the best indicators of future economic activity and the direction of equity prices. The long-term monthly chart presents the relationship to the SP500, the best index for US equities. Regardless of the media focus on one pending collapse or another, the reason why economic activity continues through the many periods of media pessimism typically experienced during a cycle is that the T-Bill/10yr Treasury rate spread remains higher than 0.20% or 20bps(basis points). The T-Bill/10yr Treasury rate spread remains the best proxy for lending profits and lending activity. This holds as true even today as it has been since 1953. It is not whether rates are rising or falling which matters to economic activity. What matters most is this rate spread which determines whether lending activity is likely to be more or less profitable. This spread also provides a measure of investor psychology with the daily chart presenting a dynamic view of current market psychology.
History shows that the widest spread occurs during recessions when investors panic which drives T-Bill rates lower. A spread of 2.25%-2.50% appears typical during recessions since 1970. Lending reaccelarates with spreads at these levels once markets have adjusted to the recession. The spread gradually closes as investors gain confidence and shift capital to higher return investments. The spread is a good indicator of lending activity and market psychology. Equity markets and economic activity continue to rise till investor enthusiasm is so strong that it drives T-Bill/10yr Treasury spread below 0.20%. At that point, additional lending slows which in turn slows the existing economic momentum. Shortly afterwards, the excesses which have entered the economy the past several years begin to emerge. Lending institutions pull back further as defaults build. A recession follows and equity markets experience recessionary correction. The rate spread widens and the cycle has come full circle. The actual direction of rates is not the important indicator. It is the lending spread which is a primary economic indicator. With today’s 1.31% (131bps) spread and rising, rising rates today do not have a negative impact on economic activity as many believe. Rising rates today are a signal that investors are selling Fixed Income for higher returns anticipated elsewhere and turning more optimistic.
From current T-Bill/10yr Treasury rate spread levels, historicaly it has taken 2yrs-3yrs before the 0.20% level has been reached. I suspect it will take a similar time frame before we see 0.20% again. Till then, it is reasonable to expect we are likely to experience an expanding economy and higher equity prices.
Be bullish! The rate spread tells you to be so.

