“Davidson” submits:
nvesting increasingly requires a global perspective. I recommend portfolios carry an exposure of 60% Domestic vs. 40% Intl Equities. A significant impact to market pricing of Intl Equities for US investors has always been shifts in the Trade Weighted US$ Index. Even if one gets the economic cycle correct, shifts in the US$ can impact Intl Equity pricing. The chart Trade Weighted US$ Index Major Currencies vs. EFA(iShares MSCI ETF) March 2008-Oct 2017 compares the US$ against the EFA(Lg Cap Intl Developed Countries) and the AWCI(All Cap World Index ex-US equities). Below this chart is the long-term history of the Trade Weighted US$ Index Major Currency vs. $WTI Crude PriceJan 1973-Oct 2017 to provide the perspective the shorter-term price history cannot and reveals the long-term declining trend of the US$ which represents the impact the US has had on raising global GDP and Standards of Living.
A weaker US$ is a global positive!. The US$ is weakening(normalizing to its long-term trend) currently.
The global economic uptrend which began early 2009 continues unabated. However, in 2014-2016 the US$ reacted to rising fears of threats to Democratic institutions and capital shifted to Western nations driving global interest rates to 5,000yr lows(believe it or not we do have a history on rates extending back that far), real estate prices in Western cities soared and the US$ experienced a sharp rise. The global economy did not slow appreciably, but specific US$ impacts occurred. For commodities and companies involved in commodity related businesses the strength in the US$ lowered prices and cash flows. These industries experienced a recession. For US companies exporting Internationally, the stronger US$ resulted in reduced International Revenues and Income. The US experienced a significant industrial recession. These industries adjusted and are now experiencing renewed growth as the US$ normalizes back to its long-term trend. The capital which pooled in the US is gradually being repatriated to Emerging Markets. US investors felt this impact twice. The impact was felt not only in flat SP500 performance 2014-2016, but in a decline in assets exposed to Intl Equities. A weaker US$ reverses the negative impact for commodities, exports and US industrial companies. The recent performance in the SP500 is due to positive earnings’ surprises coming from US industries.
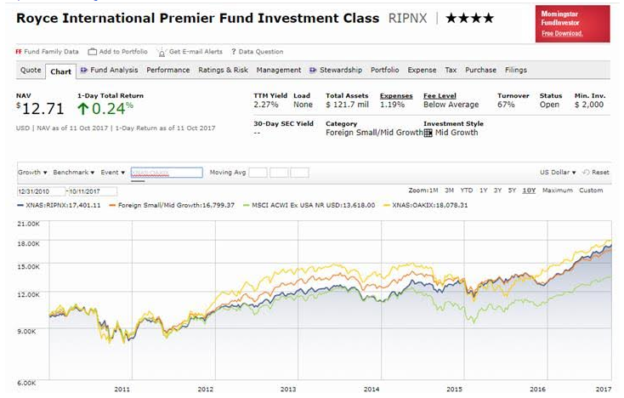
Changes in the Trade Weighted US$ Index Major Currencies mirror the performances of International portfolios. The Morningstar chart represents the price performance of Royce Intl Premier(RIPNX) and Oak Intl(OAKIX) mutual funds with respect to Peers and the ACWX Index. RIPNX-Morningstar 4-Stars and OAKIX-Morningstar 5-Stars are 2 of about ½ doz Intl managers recommended for this asset class. Both indicate declines(RIPNX less so) during the period of US$ strength 2014-2016 reflecting market pricing based on currency shifts. With the US$ beginning normalization Dec 2016, both of these portfolios have risen nearly 40%, but it can be seen that lows occurred earlier with the market panic-lows in Jan-Feb 2016. From Feb 2016, these funds have risen more than 50%! The key point to make is that while Intl issues are impacted by shifts in the US$, the better Active Managers’ investment skills add value to portfolios not provided by using Passively Indexed portfolios.
The global economic expansion continues unabated. Recent, data indicates there may even be some acceleration occurring. I continue to recommend portfolios carry 60% Domestic vs. 40% International relative weighting to equities. It is not possible to identify when market psychology may again result in shifts in US$. The best we can do is to identify the rough beginning and end of an economic cycle, identify the better managers and corporate CEOs and build diversified portfolios which meet our investment needs. One of the keys to long-term investment outcomes is patience in one’s approach. Investors can identify undervaluation and opportunity, but it may take awhile for markets to shift accordingly.
The current indications support higher equity markets the next 2yrs-3yrs.

