“Davidson” submits:
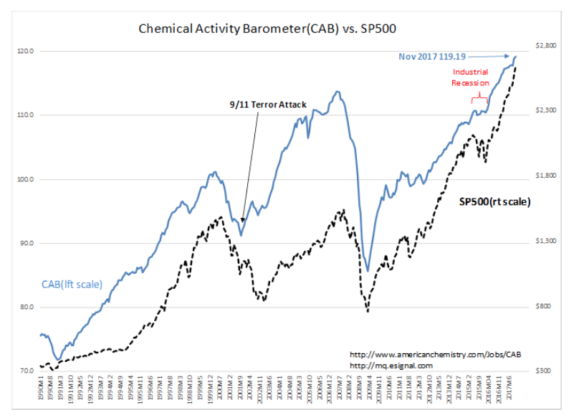
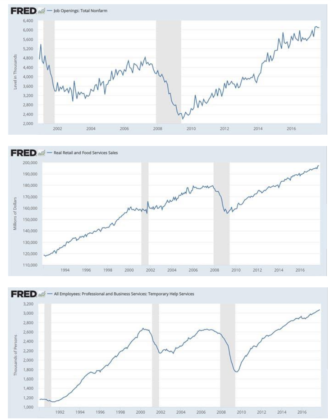
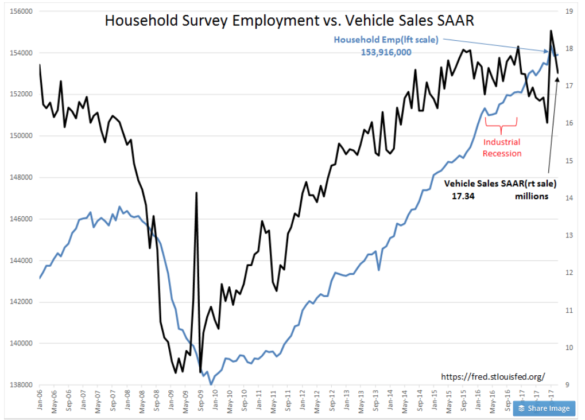
Employment and vehicle sales for November indicate a continuation of the trend established in 2009. GDP has had multiple upward revisions to which the market responds but in truth GDP is backwards looking and not useful for anticipating economic trends. Job Openings, Temporary Help, Real Retail and Food Service Sales and the Chemical Activity Barometer(CAB) provide useful forward indicators of economic activity. These continue to reach new highs.
There are many forecasts today for an economic correction/market collapse. These are Momentum Investors who believe today’s economic cycle cannot last more than past cycles as if there is a timer on economic activity like a 3min egg. Economic activity does not work that way. As long as Domestic and International policies are supportive and as long as lending continues to expand as measured by the T-Bill/10yr Treas rate spread(shown in earlier notes), economic activity will continue to expand. There is no timer on this.
Current conditions are not only favorable for continued economic expansion, the forward indicators spotted the beginnings of acceleration of economic activity roughly April-May 2016. A higher level of economic activity continues with the most recent data. Investors can expect to see higher equity prices the next 2yrs-3yrs. The SP500 Value Investor Index(in an earlier note) suggests equity markets could rise to ‘silly levels’ as market psychology turns towards optimism. It is speculation and a high level of optimism which chokes lending and economic activity. Not the length of a cycle!
The CAB, Retail Sales, Job Openings, Temp Help and T-Bill/10yr Treas rate spread have a history of identifying economic/market tops well in advance of the need to adjust portfolios. I expect the same this cycle. I encourage investors to add capital to take advantage of equity markets as market psychology improves from current levels of pessimism.


