“Davidson” submits:
US Real GDP & Real Private GDP highest this cycle-meets skepticism
Economists the past couple of months have shifted GDP forecasts sharply higher as economic evidence and headlines forced them to reassess earlier levels of pessimism. Today’s 4.1% report now becomes a disappointment from recent expectations of 4.4% with some having expected 5%+. Even 4.1% was dramatically above estimates of 6mos ago. https://www.cnbc.com/2018/03/23/the-economy-looks-weak-in-the-first-quarter-but-better-days-are-coming.htmlFunny how forecasts seem to work that way without any mea culpa’s. The commentary on this release was mostly dismissive. Go figure!
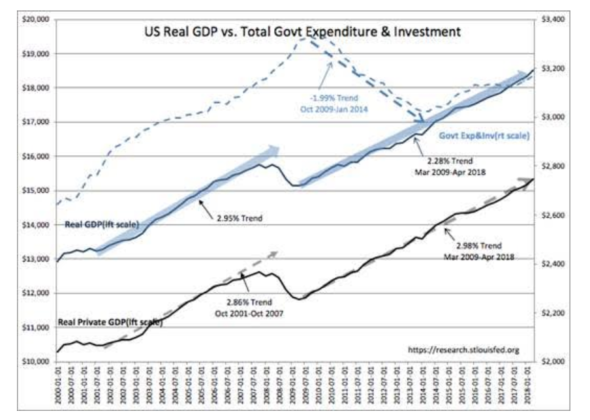
In my work, I observe that increases/declines in Govt Expenditure&Investment correlate with increases/declines in inflation 12mo-24mos later. Govt Exp&Inv is part of GDP, but, in my opinion this type of spending adds mostly to inflation and little to long-term GDP. Government spending inflates currency without a productive return. I separate out Private GDP from GDP to understand the economic strength of the underlying private economy. The recent US budget expansion in military spending is showing up in a rise in Govt Inv&Exp(see the DASHED BLUE LINE).
Real GDP has shifted the trend from March 2009 to 2.28% (over 9.25yrs) from last reported 2.24%(over 9yrs) due mostly to the increase in Govt Exp&inv. Real Private GDP inched higher from 2.94% to 2.98% which has been comparable historically.
GDP measures reflect events observed after the fact and are not predictive. Just the same, the consensus attributes considerable implications on each report and subsequent revisions have no relevance when anticipating future growth.
The one area of concern is that the rise in Govt Exp&Inv correlates to rises in inflation in 12mos-24mos. Inflation increases have always favored commodities and industrials. Only a handful of observers the last 2,000yrs have connected inflation to periods of rising government spending. Mostly investors believe inflation comes from rising money supply, rising wages, rising commodity prices or something else other than governments inflating currency without adding to GDP long-term. The history of rises in commodity prices follows inflation once investors perceive it to be an issue.
Chemical Activity Barometer(CAB) posts a record high
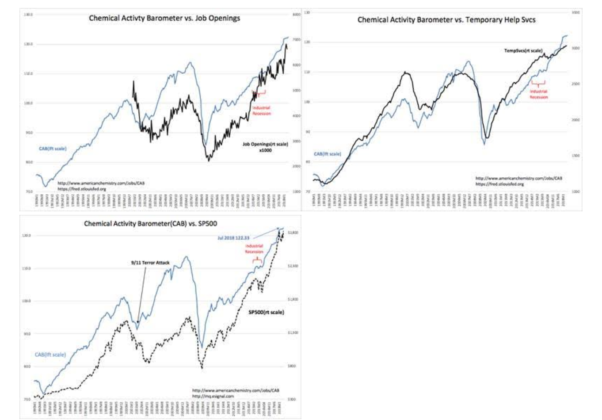
The Chemical Activity Barometer(CAB) posted a record high with this month’s report. Coupled with Job Opening and Temporary Help trends the CAB provides decent indicator of future economic surprises. With the current skepticism expecting limited success on the Administration’s dealing with threats from Iran, Russia, China and No Korea, expecting a temporary and limited impact from the recent tax and regulation reductions and expecting even less from the effort to reduce global tariffs, the trends in the CAB, Job Openings and Temp Help data portend significant positive surprises relative to current investor thinking. Several prominent forecasters are calling for a recession in the next 12mos-18mos.
The Investment Thesis July 27, 2018:
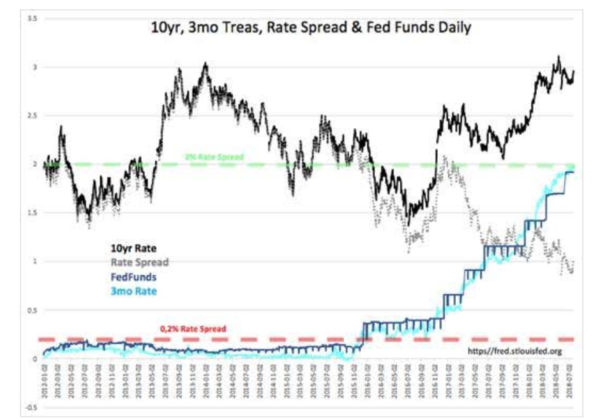
The current economic expansion continues at roughly the same pace as it has since March 2009. Any investor skepticism at this point is more than likely to force skeptics to reenter equities at higher prices as headlines are likely to be much more positive than expected. In my opinion, market psychology remains average using the T-Bill/10yr Treasury rate spread as a gauge. After a brief dip to 0.90%, the T-Bill/10yr Treasury rate spread has shifted back to 1.01% or mid-range its 60yr+ 0.20%-2% range as a helpful market psychology/economic indicator.
Commodities and Industrials should be favored if the rise in Govt Exp&Inv results in higher inflation.


