“Davidson” submits”
Policies to remove constraints to business flows have accelerated the global economic expansion. The changes currently in process are likely to add additional economic runway. What has been accomplished thus far with additional effort promised:
1) Significant reduction in regulations
2) Lower taxes
3) Reductions in threats from terrorism
4) Lowering global tariffs
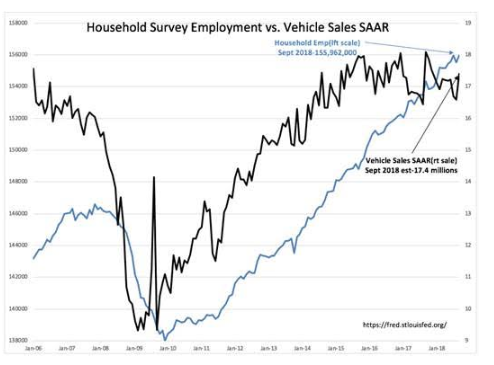
Thus far, US Real GDP has accelerated from less than 2% to currently a little over 3%. There is potential for something higher as policy changes such as these take some time for full effect. The primary measure for economic activity is employment. The Household Survey this morning indicated a employment consistent with the trend since 2009. Vehicle Sales are likely to remain at current levels for the foreseeable future, a more or less a steady state.
The many forecasts for a market top this summer have now mostly evaporated.
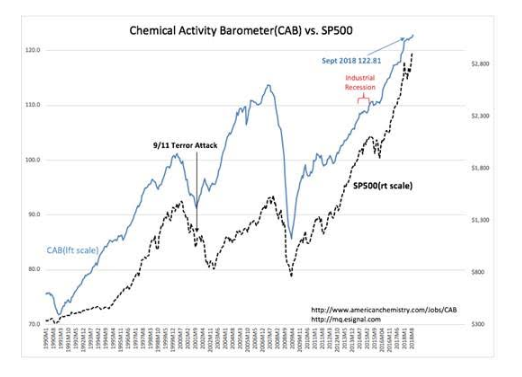
CAB was again revised higher, the T-Bill/10yr Treas spread widened and other economic positives keep rolling in. We should expect more of the same the next few years. The CAB(Chemical Activity Barometer) because of how widely chemicals are used in everyday commerce and retail consumption, is a basic measure of economic activity. The report this week was revised higher. The CAB leads SP500 prices by 12mos-24mos. The current CAB trend should produce a significantly higher SP500 the next 12mos+.
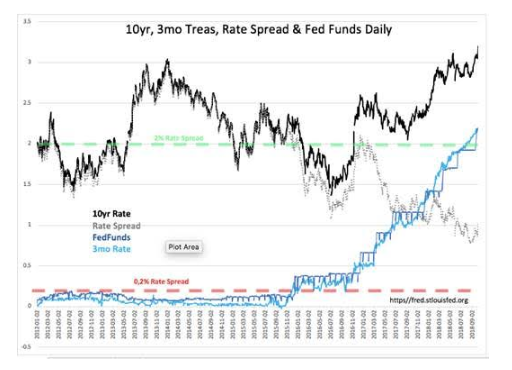
As investors gain confidence that equity returns are likely to be higher fixed income, ‘The Recency Effect’, they shift more capital to equity. This results in 10yr rates rising and is a positive sign. Market cycles to not top till investor enthusiasm also drives T-Bill rates to similar levels which reduces the T-Bill/10yrTreas rate spread to 0.2% or lower. Historically the pace of bank lending profits which depend on fees and this rate differential slows considerably on the spread contraction to 0.2% and economic correction follows. As 10yr rates have risen recently, the spread has widened somewhat to 1.02% from 0.80% just 8wks ago. This is positive for continued bank lending, continued economic expansion and higher equity prices.
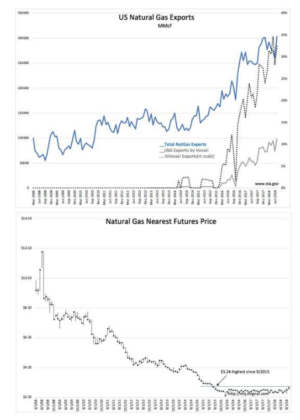
Another sign of the global economic expansion has been US LNG Exports. We are beginning to see rising natural gas prices after 10yrs of declining and depressed pricing. The innovation of a system of compressing and transportation of natural gas, LNG(Liquified Natural Gas), of which the US has been in oversupply is now undergoing dramatic change. LNG which only began to be shipped in quantity in 2016, now is more than 30% of all US Natural Gas Exports and likely to reach 50% in 2yrs. The demand for this cheapest of fuels globally is very strong. The impact on prices appears to have passed a tipping point recently with prices rising to $3.24/MMcf, a 3yr high. Being the cheapest fuel available, it is likely we will see all energy prices rise with the price of natural gas as demand continues.
US energy sector is strongly recommended as a portfolio holding at this time.
The Investment Thesis October 5, 2018:
Multiple measures of economic activity continue to trend higher with benefits of US policy shifts. Recent success in tariff reductions with Mexico, Canada and So. Korea are likely to lead to success with Japan, Europe and eventually China. Investors should expect continued global economic expansion for 2yrs-5yrs with the US equity market being the primary beneficiary.
In my opinion, investors should have portfolios entirely dedicated to US equities at this time.


