“Davidson” submits:
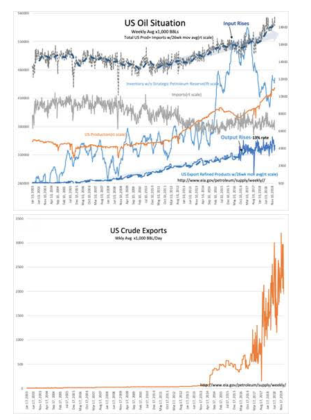
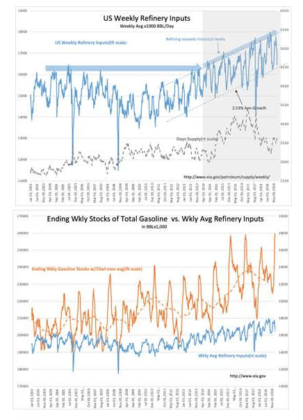
US Oil Production at 11.9mil BBL/Day is a record high, but so are crude exports while imports are declining. The market focus on single metrics misses the global expansion which drives global energy demand. The US Oil situation chart(click and drag corner to expand chart for greater detail) shows Total Crude Inputs to the US oil processing system has climbed to record levels. The US has ramped its refining capacity to meet global refined product demand which has a 13% annual increase since 2006. Changes in regulations permitted crude exports to rise to record levels, now ~3mil BBL/Day
Weekly reports are volatile with Spring and Fall shutdowns for maintanence and seasonal EPA fuel blend regulations. This results in high levels of seasonal volatility in US Crude Inv and US Gasoline Inv. It is shifts in these reported levels which often drive oil prices as much 3%-5% due to short-term investors. Scheduling shifts in 3 or 4 supertanker carrying more than 1mil-2mil BBL each can cause unexpected inventory adjustments at any time. Traders react with as little as 1mil difference from expectations. Note: 5mil BBL shift in US Crude Inventories when levels are 435mil BBL represents slightly over 1% are well within the error of measurement for these reports and single reports provide little meaningful information regarding the inventory trend. Gasoline inventorie of 250mil BBL likewise make single small weekly shifts meaningless. Nonetheless, traders must be traders and the media exaggerates the importance of these reports which drives advertising revenue.
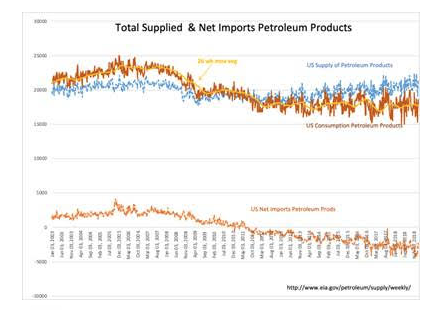
The Big Picture is the US continues to consume less and less energy to achieve internal growth. The net/net is that the US is raising its Refined Product production to meet global demand. Seasonality and economic variability create short-term volatility on which many focus and lead them to miss this larger trend. The US Export of Refined Products is growing ~13% annually while global crude demand is growing ~1.75%. Many developing nations do not have oil reserves and must import refined products and some of those that do, import refined products because they have not yet justified their own domestic refining capacity. Venezuela is one of these who export to US refiners for importation of refined products.
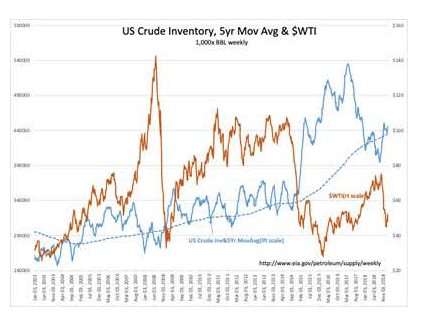
Markets speak of supply/demand as the driver of oil prices. But, there are many inputs to price including the US$(US Dollar), perceptions of economic activity, geopolitical threats and misperceptions of excessive or deficit crude inventories vs demand. Recently oil prices have plummeted due to recession fears to which Hedge Fund investors have coupled using algorithms. Part of this misperception includes the current level of US Crude Inventories vs. its 5yr mov avg. A recent rise in crude inventories above the 5yr mov avg in Oct 2018 supported the belief that an economic recession was beginning. It was not! The answer lies in the Big Picture.
The Big Picture about economic activity, crude demand and etc is that the seasonal Fall shutdown coincidentally occurred with missile launches by China, Iran and Russia which spiked the US$ higher. We witnessed foreign investors drive down US 10yr Treasury rates in their rush to safety which helped to trigger recession fear and algorithms forced a 40% decline in oil prices and a 20%+ decline in equity markets. Short-term traders entirely ignored very positive economic trends and the media helped fuel this particular panic.
Part of the Fall refinery shut down has been reversed and the market panic has partially eased. A full reversal is likely to take several months as Exxon has partially shut in its Bayside refinery for 2mos to double capacity. This action took ~280,000BBL/Day of refining capacity out of the system and is reflected in the recent sharp decline in US Weekly Refinery Inputs. In turn, US Crude Inventories continue to hover above the 5yr mov avg and traders continue to fret about “over-supply”.
I expect traders to price oil higher once Exxon has completed its Bayside project an US Crude Inventories fall below the 5yr mov avg.


