1) US Crude Inv fall 8.5mil BBL, ~10mil BBL below 5r mov avg
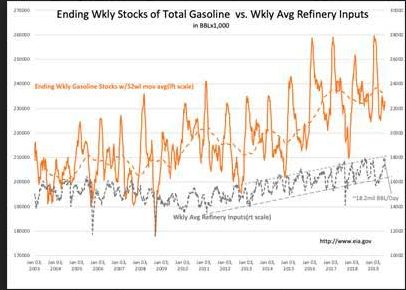
2) Gasoline Inv fall 1.8mil BBL
3) Refining Inputs fall 200,000 BBL/Day, 1.2mil BBL/Day below seasonal expectations
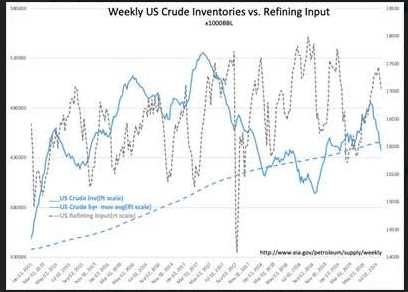
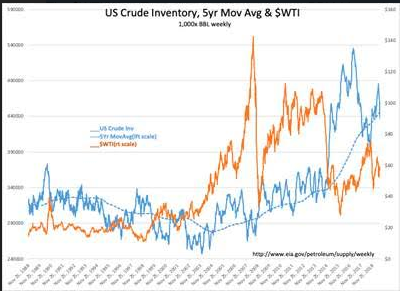
The $WTI(West Texas Intermediate price per BBL) history has risen sharply with every instance of US Crude Inv declining below its 5yr move avg. We are beginning to see this occur once again.
The American Petroleum Institute (API) reported a crude oil inventory draw of 6.024 million barrels for the week ending July 25, compared to analyst expectations of a much smaller, 1.818-million barrel draw.
The inventory draw this week compares to last week’s massive draw of 10.961 million barrelsin what was the largest inventory draw this year, according to the API. A day later, the EIA confirmed an inventory drawdown of 10.8 million barrels.
“Davidson” submits:
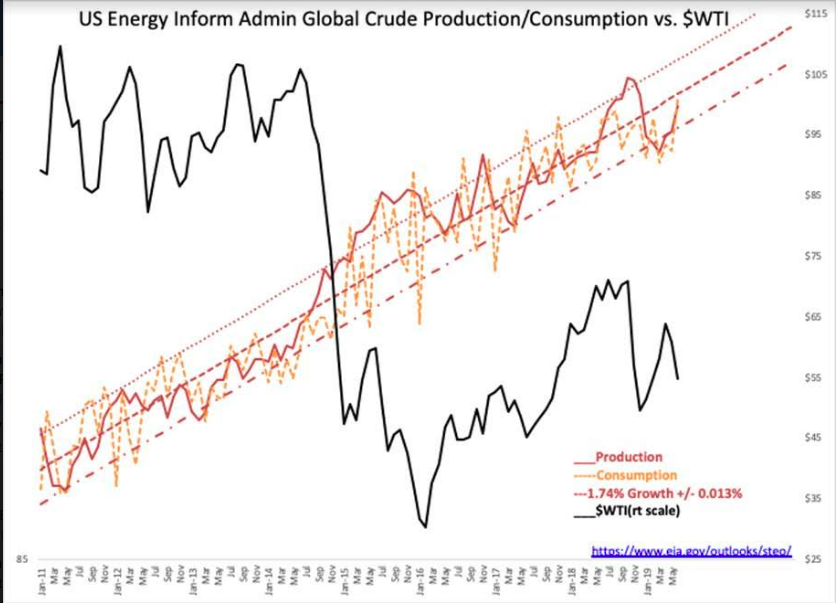
US EIA Global Crude Prod/Consumption monthly history Jan 2011-July 2019 is 1.74% which varies by +/-0.013%(not a lot). The variation in prices comes from market psychology perception of Supply/Demand, not from actual variations in Supply/Demand.
Periodically one should review the data to determine if there are any changes in the trend. There is no indication that this is the case. The longer the trend, the better the estimates of the growth rate and the variability. The earlier est had been 1.75%, current data supports 1.74% +/-0.013% and consistent with global population growth and improvements in standard of living.
Access member-only content FREE for 5 days… use code “VP30” for 30% off