“Davidson” submits:
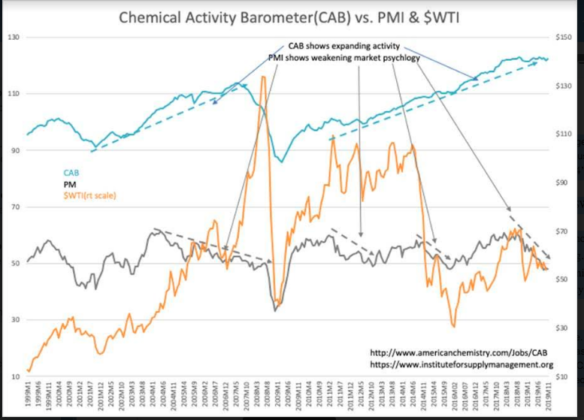
It is interesting to compare two market psychology driven measures, $WTI and PMI(Purchasing Managers Index) with CAB(Chemical Activity Barometer), a mostly economic indicator based on chemical production and shipment activity. The chart notes previous correlations that have reversed today.
- Economic activity expanded Oct 2001-July 2007 per CAB, but PMI fell from May 2004’s level of 61 as $WTI rose with ‘Peak Oil’ fears. Investors feared higher $WTI would stifle growth.
- Economic activity expanded 2008-Present per CAB, but PMI fell again midway when $WTI rose May 2011 on fears higher oil prices would slow economic activity.
- 2014-2016 saw $WTI plummet again causing the PMI to fall with fears of slowing economic activity, CAB continued in an uptrend
- Curiously, 2016 saw a rising PMI and rising $WTI indicating a shift in investor thinking. ‘Peak Oil’ fears diminished with fracking success well established-rising prices now believed to reflect higher economic activity and algorithmic trading incorporates this thinking
- Today higher/lower $WTI correlates to higher/lower PMI even though economic activity per the CAB continues to rise. PMI plunged 2018 and took $WTI prices lower while CAB held to trend
Applying investment hindsight is more than finding past relationships with which to anticipate the future. Recognizing that past correlations can evolve into new relationships is also part of hindsight. Investing is a continuous process requiring frequent revisits to past assumptions. The real lesson which evolves is that hindsight identifies it is market psychology which determines market prices not economic activity. The CAB, a mostly hard count of economic activity, provides a good comparison to $WTI and PMI on which many rely to make investment decisions as if they are economic measures. They are not!
