“Davidson” submits:
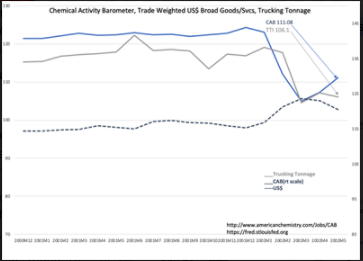
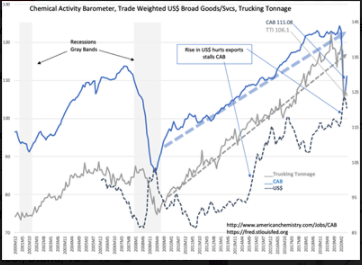
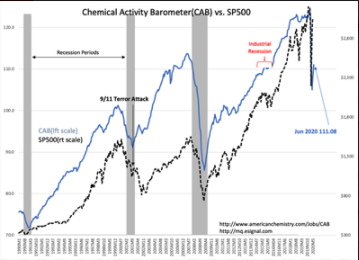
The Chemical Activity Barometer(CAB) and Trucking Tonnage Index(TTI) continue to rebound. 3 charts show how these indicators relate to economic activity and the SP500 long and short term and their relationship to each other.
- The CAB vs SP500 chart shows the longer term correlation of the CAB, SP500 with economic activity and recession periods. The correlation is quite impressive and holds since 1926(inception of SP500). It missed a little in 2001 when economic activity turned higher the same month 9/11 occurred. The SP500, driven by market psychology, took another 12mos to recognize that the economy had turned higher Sept 2001.
- The CAB vs TTI and US$ chart shows the CAB tends to lead the TTI with business activity with both sensitive to periods when US$ strength hurts exports.
- The short term chart shows recent detail with the CAB rebounding faster than the TTI.
US economic activity is rebounding from the COVID-19 shutdown. Many states have reopened, but significant contributors, i.e. New Jersey, New York and California, remain in early stages. The current pessimism reflected in the discounted industrial issues is not justified with the rebound reflected in the CAB and TTI.
The market carries 2 perceptions. One group of investors believe that COVID-19 will remain as a recessionary influence and likely to return as COVID-19 Part II and excessively favor FANG type issues with valuations ranging 10x-70+x Revenue. Other than this small group of Momentum Investors, the remaining investors are uncertain and expecting a deep recession. The economic evidence shows a rapid return of general economic activity. The CAB and TTI do not support the extreme pricing given to the COVID-19 theme. As additional economic reports support the view of that a general economic recovery is in progress, the heavily recession- discounted issues are likely to have significant rebound.
Buy equities where corporate insider activity is strongest!


