“Davidson” submits:
The Federal Register(FR) data is released annually mid-year for the prior year. This is one of the least noticed data releases yet remains the most important market and inflation indicator yet to be recognized. There is a significant portion of investors who seek earliest access to data in order to trade ahead of the consensus. It is a focus which leads to active trading via computer driven algorithms as ever more detailed and timely data comes into view. Data of this type of called “High Frequency”. The most frequent data are price trends which can emerge and disappear within days which is responsible for huge market swings as Hedge Funds jump from position to position. Data which is updated with ‘low frequency’ is ignored as not tradable. This leaves the FR data ignored when in fact it provides the most important of future economic signals leaving every other data series as secondary indicators.
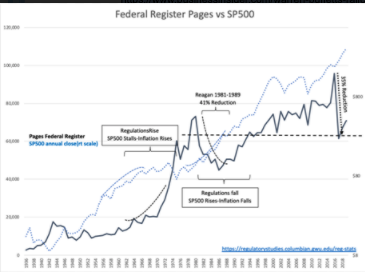
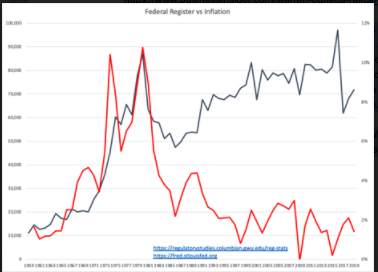
The FR reflects a summary of the Federal regulatory burden on society. Mostly regulation has added costs of compliance to society and for this reason a higher page count in the annual FR has considerable correlation with inflation and business fundamentals which market psychology translates to equity and fixed income market performances. The relationship is higher regulatory burden results in higher inflation, weaker business performance, higher unemployment and weaker equity markets. With weaker equity markets, there is an domino impact to pension plan performance adding additional burdens to business. The FR is imperfect as a guide as regulations to reduce regulatory activity also add to the annual page count. Interpretation of the FR requires taking into account the policy stance of the current administration towards regulatory policy.
https://regulatorystudies.columbian.gwu.edu/reg-stats
“The number of pages in the Federal Register—the daily journal of the federal government in which all newly proposed rules are published along with final rules, executive orders, and other agency notices—provides a sense of the flow of new or changed regulations issued during a given period. These regulations might increase or decrease regulatory burdens, making this an imperfect—but frequently cited—measure of regulatory burden.”
The current administration has clearly been reducing society’s regulatory burden. Current statements indicate a continuation of these actions. The last time the US saw this level of deregulation was during President Reagan time in office. The ‘miracle economy’ still leaves many economists in awe having little comprehension why it occurred. Bringing hindsight to bare in comparison with recent economic responses to the policies of the current administration has allowed important but previously hidden relationships to emerge. The first time this occurred under Pres. Reagan, it seemed a fluke. The second time, as is currently in process, shows this was no fluke at all and leads to reinterpretation of previously held assumptions regarding inflation, money supply, employment, productivity and etc.
The short and simple interpretation is that less regulation is correlated with less inflation, higher pace of economic activity, higher employment and productivity. This has already proved the case since 2017. Reduction in regulation has a long term impact, perhaps lasting10rys or longer, till another regulatory burden is imposed. Money supply growth or too much hiring as causes of inflation are debunked as being important sources of inflation. Oil pricing is a response to inflation, not a cause of inflation. While poorly managed directed-government spending is inflationary, this source is not as important as regulatory over-burden. Low unemployment only occurs when economic demand is productive for hiring. There is no record of business hiring to make themselves less productive. In other words, higher unemployment correlates to higher inflation as businesses seek to lower costs.
The US entered the COVID-19 with the best context of economic conditions and level of activity in more than 50yrs mostly due to Domestic regulation reductions, initiatives to lower global tariffs and lower domestic taxation. US debt delinquencies were trending towards 17yr lows even in the face of several bouts of stronger US$ which clearly hurt industrial and farming exports. The periods of strong US$ are the result of global capital seeking better capital returns than elsewhere. Each instance of stronger US$ was met with economic activity taking a period to adjust before resuming its upward trajectory.
The short term evidence today suggests a rapid recovery from the COVID-19 shutdown period. Railcar traffic has returned to ~98% pre-COVID-19 levels in the latest report. Railcar traffic is Warren Buffett’s favorite indicator.
Warren Buffett was right: Trains are awesome at telling you what’s going on in the economy
https://www.businessinsider.com/warren-buffetts-railcar-desert-island-indicator-is-accurate-2015-6
While most are looking at the weekly high frequency tea leaves to parse economic trends, the annual FR data is forecasting a vibrant economic future. Strong economic activity and rapid recovery from events like the unexpected COVID-19 is occurring primarily because lower regulatory burden makes it easier for society to adjust and regain its traction. Should additional deregulation occur, we can expect additional positive economic responses as long as net deregulation results in positives for society as a whole. FR data is the most important big picture indicator for future economic activity in my opinion and its forecast is quite positive.
Rates remain historically low with the 10yr Treasury at 0.07% while equity returns are many fold higher. Even companies with long records of paying dividends with dividends above 2% today represent more than 20 fold better long term returns relative to 10yr Treas. Buy equities!

