I’m gonna disagree on this one. I still maintain a lot of the “liquidity” we are seeing out there is owed to someone (rent, utilities, other bills that have been) for items in forbearance. This is gonna be interesting to see how this plays out either way but I am erring on the side of caution at this time.
“Davidson” submits:
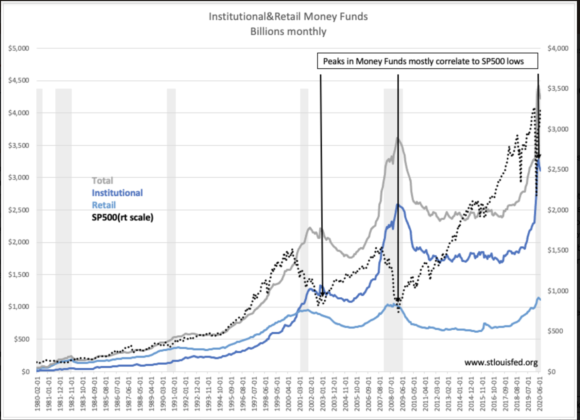
Money Funds indicate that current market prices are closer to the major lows of the past with higher prices to come
One of simplest relationships for determining major equity market lows is that between equity market indices such as the SP500 and the amount of capital in Money Funds. Often referred to as ‘cash on the sideline’, Institutional and Retail Money Funds nearly always peak as equity prices bottom during severe corrections. Money Fund capital peaked simultaneously with market lows in 2003 and 2009. This year, with the COVID-19 shutdown, equity markets bottomed in March 2020 while Money Funds peaked May 2020. Perhaps this was due to the European ban on short-selling which sent global capital into the US driving the US$ nearly 10% higher in 3days. Once the lows were established, the patterns suggest that capital remained in the US and likely entered Money Funds for a period. Afterwards, the US$ began to return to pre-COVID -19 levels suggesting a shift back to Europe as bans on short-selling were lifted. While this is a different pattern than 2003 and 2009, Money Funds remain a good indication of investor pessimism.
Previous Money Fund peaks were followed by sizable rises in the SP500 to new highs for several years. Money Funds continue near record levels with the SP500 barely above its Feb 14, 2020 high of 3,380. Once those pessimist investors who are responsible for high levels of Money Funds turn more positive, equity prices can rise significantly from current levels.
