“Davidson” submits:
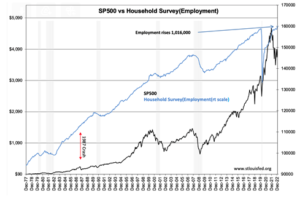
Good news is difficult for some investors betting on recession and lower rates. With this morning’s employment reports revealing stronger economic trends than expected, Household Employment Survey rises 1,016,000, Establishment Survey rises 517,000, and Wards Automotive est Jan vehicle sales of 15.74mil SAAR(Seasonally Adjusted Annual Rate) vs Dec 13.31mil SAAR, a big jump, the overall picture is far more positive than anticipated. This month the Bureau of Labor announced significant revisions and is why tracking the trend is more valuable for economic insight than any single report.

Excerpts from today’s US Employment Situation report:
“Total nonfarm payroll employment rose by 517,000 in January, and the unemployment rate changed little at 3.4 percent, the U.S. Bureau of Labor Statistics reported today. Job growth was widespread, led by gains in leisure and hospitality, professional and business services, and health care. Employment also increased in government, partially reflecting the return of workers from a strike.”
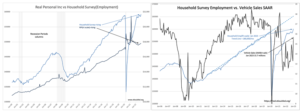
…further along in this report… “In accordance with annual practice, the establishment survey data released today have been benchmarked to reflect comprehensive counts of payroll jobs for March 2022. These counts are derived principally from the Quarterly Census of Employment and Wages (QCEW), which counts jobs covered by the Unemployment Insurance (UI) tax system. In addition, the basis for industry classification in the establishment survey has been revised from the 2017 North American Industry Classification System (NAICS) to NAICS 2022. Approximately 10 percent of employment was reclassified into different industries asa result of the NAICS revision. Implementation of NAICS 2022 resulted in major revisions reflecting content and coding changes in the retail trade and information sectors, as well as minor revisions within the mining and logging, manufacturing, wholesale trade, financial activities, and other services sectors. Many industry titles and descriptions were also updated to better reflect official NAICS titles.” Three charts place today’s employment in perspective of the whole picture with revisions applied, Real Personal Inc vs. Household…, Household…vs Vehicle Sales SAAR and SP500 vs Household…. The points these charts underscore are: · Higher employment produces higher Real personal income(income adjusted for inflation)· Higher employment creates higher demand for vehicles and everything else· Higher employment eventually results in a higher SP500 pricing(the 1987 Crash is a prime example of economics over market psychology) The tone in the media is shifting from extreme pessimism to “my god, it’s far better than we thought”. The initial decline market prices this morning is from traders expecting lower interest rates on weakening economic activity. Their models focused on a tech company rebound associated with similar economic weakness during COVID that proved favorable for this approach. This is mathematical modeling without consideration to economic fundamentals. Mathematical modeling for markets which are a human system without a mathematical solution has an apt reference in history.
“A Blind Man in a Dark Room Looking for a Black Cat That Is Not There”
https://quoteinvestigator.com/2015/02/15/hidden-cat/
The COVID-issues continue to miss expectations with Apple(AAPL) yesterday’s prominent example. Eventually and perhaps much sooner than expected these investors will recognize the earnings increases from the other part of the economy long ignored. In my opinion, the bulk of non-tech related companies represent the better investments at this point in the cycle. Investor should expect rising rates with rising inflation and focus on those businesses fundamental to economic growth which will be able to pass on price increases and remain profitable, industrials and energy related.
There remain many good companies still priced at severely discounted levels vs historical levels.
