“Davidson” was right about REIT’s before anyone…..
The updates for REITs, EmgMkts and R2000 indices are below with a notable change in R2000.
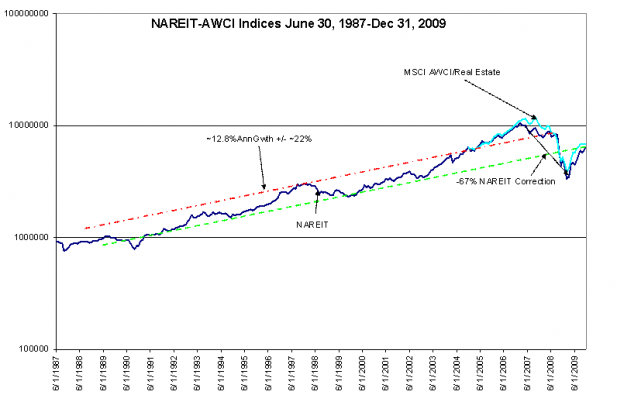
First, the long term performance of the REIT index appears relatively insensitive to inflation related pricing when compared to the SP500 which is highly correlated to my Market Capitalization Rate = Real US GDP + core Inflation. I have not discussed this with you, but those in the industry have told me that when inflation heats up so do asset prices and leasing income AND when disinflation falls asset prices rise due to lower Market Cap Rate and lower cost of debt. Real estate has always carried these win/win characteristics which those most savvy in the business anticipate by maintaining flexibility in their funding. Chart 1 below updates ONLY the NAREIT Index through Dec 31, 2009, I will send the MSCI AWCI/Real Estate once we receive it.
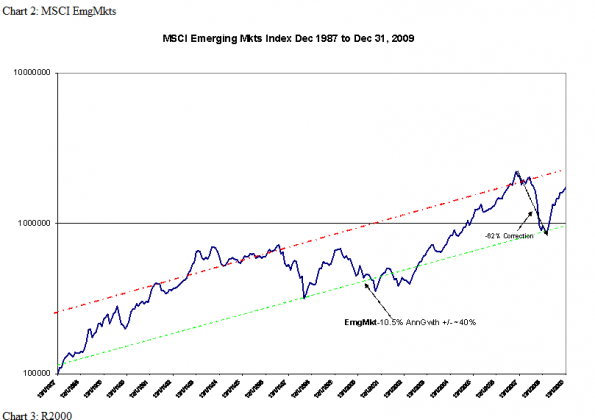
Second, MSCI EmgMkts (Chart 2) which also carries a large component of natural resource related issues(~50%+) tends to act like the REIT indices with regards to inflation. The current price level of EmgMkts needs to be monitored for excess risk development. The very strong returns since the March 2009 lows has rapidly retraced more than half the historical spread between being “out of favor” and “must own” levels. Should the market push this index much higher in the next several months, then I will recommend that we pull back from our 5% allocation to reduce our risk.
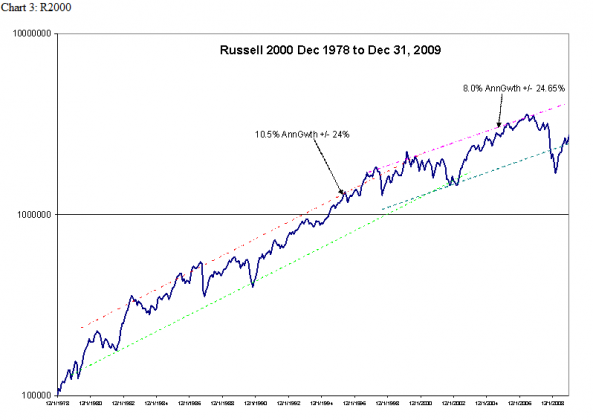
Lastly, the R2000 Index (Chart 3) has added trend lines. The new trend is justified from studies on the SP500 and represents the R2000’s response to the end of disinflation in the 1996-1997. Markets are “fuzzy” and in my experience it can take 2 investment cycles (~10yrs-15yrs) to elucidate how a market is responding to underlying fundamentals.
By comparison, the SP500 membership has a relatively stable membership and provides fundamental benchmarks. This is why an Earnings Yield can be compared to a Market Cap Rate with useful results. I have attempted to study the R2000 similarly, but it does not yield to fundamental analysis, i.e. P/BV, P/E or Earnings Yield. The reason is that the R2000 membership is transient with members entering as smaller companies and then exiting some years later when they exceed Russell’s range for R2000 members. This causes underlying fundamentals to change and in the process makes the R2000 only useful a price index.
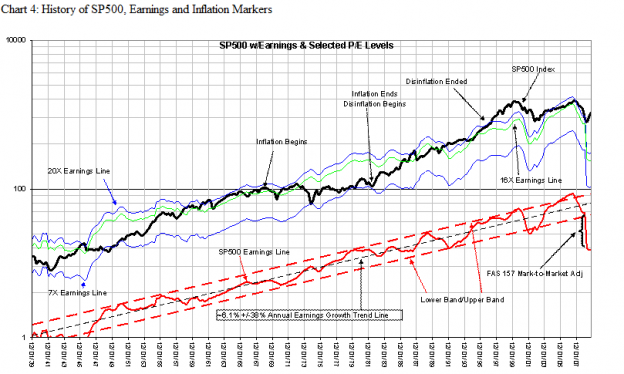
In Chart 4 I added inflation/disinflation markers. There is a demarcation in the SP500 in 1996-1997 which is hidden due to the Dot Com Bubble. The best means of looking at inflation effects in my experience is to draw the channels. I have done this elsewhere and can show the work to you. The SP500 should grow with fundamentals at ~6.1% annual pace, but displayed annual ~1.8% growth in the ‘70’s as P/E’s fell in response to rising inflation and then experienced ~12.7% growth with the P/E rise in response to disinflation of the ‘80’s-‘90’s. The R2000 series was not long enough (1978 inception) to reveal similar responses till the recent correction. With these observations I have tentatively added the new trend lines you see in Chart 3 which are likely to be adjusted as we get additional information.
Inflation is a man-made (excess government spending due to social-engineering programs-my observation) element in our economy and one cannot predict it from year to year as it depends on who is pushing cash generation button. Meltzer provides good insight to Pres. Johnson’s input in his paper “Origins of the Great Inflation” which I have attached.


