“Davidson” submits:
Investors are concerned about China, concerned about consumer confidence, concerned about why in the US the Federal Reserve did not raise rates, concerned about the falling specific country PMI indicators (published by a firm called Markit) as well as our own PMI(Purchasing Managers Index). The media has become awash in negative forecasts by Technical Analyst types. What do they see that the rest of us do not see? The facts are that Technical Analysis, PMI indicators and consumer confidence measures only reflect how people feel, not what they are doing with their money.
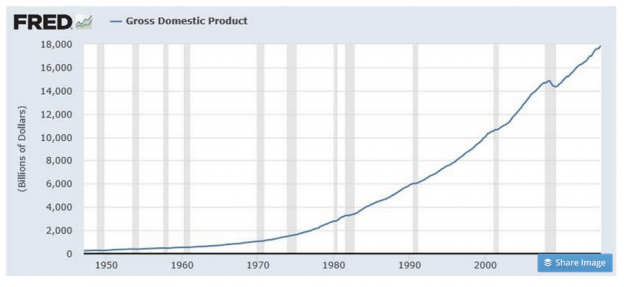
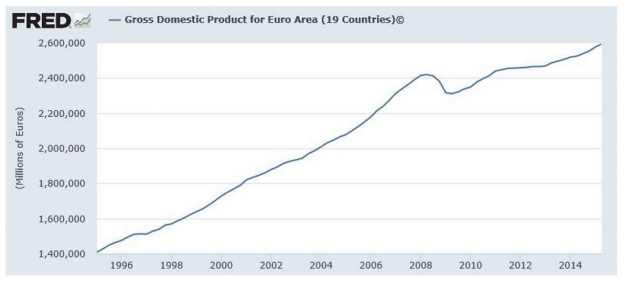
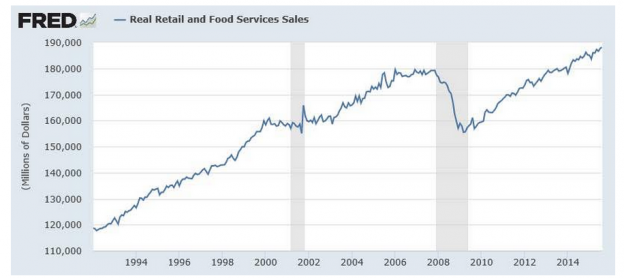
The real question that should be asked is what are all these people missing who issue forecasts based only on sentiment! Two charts immediately below show the US GDP(Gross Domestic Product) and the Euro Area(19 Countries) respectively thru July 2015 and below these is the chart for US Retail and Food Service Sales thru August 2015. These are economic measures. They are not sentiment indicators but measures of how people are spending their money. These are counts of the value of production and consumption. One can see that the US data clearly shows that the trend in consumption and production has always slowed prior to recessions(gray shaded areas). It should be easily seen that there is no slowing in these trends since 2009.
In every year of the current economic expansion we have had at least one period of investor pessimism with forecasts that recession is to occur the next few months and stock prices to decline. The forecast for the Dow Jones Industrial Average falling to 5,000 has been made and repeated so many times that it is difficult to count. Not only have none of these forecasts turned out to be true. One could have easily dismissed these dire forecasts by just looking at any of the many economic indicators we have available. St Louis Fed FRED site now offers 291,000 data series in Excel format covering US and Global economic activity from both current and historical perspectives. The data is provide at no cost to anyone with a computer and an Internet connection.
Not only is the US economy continuing to expand, but so is the economy which comprises 19 Euro Area countries. It is economic activity which has always determined the ultimate direction of equity prices even with periods of which appear to be bordering on extreme pessimism. In general, stock markets do not peak till economic activity peaks. If you are a Value Investor as I am, you need to weather many false forecasts by those who use other than economic data as their main analytical input. I have often said that Technical Analysis is similar to someone trying to predict where all the fish are in the ocean by looking at the waves. Stock prices are reflections of market psychology and market psychology can flit from optimism to pessimism in a minute’s notice over the short term. Over the long term, market psychology shows it is determined by economic trends. The widespread belief that market psychology determines economic activity is a consensus misperception which has been part of investor thinking for hundreds of years. The widespread availability of the economic data (available to anyone, anytime) is a very recent event. The St Louis Fed first began offering a few thousand data series only since 2005.
My opinions on using economic data have been shaped by my scientific background (30yrs of chemistry, physics and math study) coupled with my 30yrs+ of investment experience. The first 23yrs of my investment career frustrated my every effort to make sense of Wall Street recommendations and general advice. Once the St Louis Fed went live with St Louis Fed FRED, it took only a few years for things to fall into place. The market viewed as a human system with various shades of market psychology determining market prices tracking the economic activity underneath it all was the result. The markets can never be understood as a math problem to be solved by algorithms. Market behavior and pricing has varied with how we have adjusted the rules of fairness by which we operate. Market pricing has varied with the impact of various government social engineering agenda. The market represents a fascinating history of human progress both socially and technologically. None of this yields to the mathematical analysis we have tried to impose on it for more than 100yrs. But, all becomes clear once markets are viewed as a human system using empirical methods.
What I present here is not the view of Wall Street. At the moment, you will likely not find anyone who has a similar perspective. But, the data is there for all to access and at some point there should be other individuals who develop the same perspective as I present here. History is replete with multiple individuals discovering the same ideas coincidentally even though separated globally.
Net/Net:
The many who have become pessimistic lately simply have not learned how couple the economic data available to markets. Humanity has always exaggerated its fear especially when we cannot locate the facts to counter it. The historical relationships make it clear that economic activity drives market prices. With economic activity in a clear uptrend with no slowdown in sight, the current bout of fear should pass and be replaced by optimism as economic activity plows slowly ahead.
My recommendation remains very positive. Global expansion continues and likely to accelerate. Buy stocks!!!


