“Davidson” submits:
There has long existed a relationship which matters greatly to economic activity. That relationship is called “The Credit Spread”. Money has been lent for thousands of years based on expected returns. In the modern economy we have today ,we talk about “The Credit Spread” which is the difference between any long-term lending rate vs. its relative short-term rate. The short-term rate represents what savers/lenders are willing to accept/provide for capital which takes little financial risk based on current expectations. The long-term rate is the expected return on capital lent to borrowers and carries the risk not found in short-term rate.
When I began my career ~35yrs ago everyone talked about “The Credit Spread”. Today, everyone talks about rates as if it is the rate, the short-term rate, and importantly the rate the Fed sets, the Fed Funds Rate. Today’s discussion is universally about the next Fed Funds Rate hike as if the Federal Reserve controls the economy. The extensive economic data we have available has never supported the wide-spread belief repeated ad nauseam in every media that the Federal Reserve controls US economic activity. Actual control lies in the Free Market. The Free Market comprises us all. All of us are deciding how we want to advance our own standard of living. Every day we make decisions to spend our net income to improve our standard of living selecting the cheapest and highest value goods and services which we believe will do this. On the opposite side of individual spending are all the companies competitively seeking to make the goods and services attractive for individuals to buy them. It is fair to say that the Free Market is ‘us’ having freedom of choice exercising individual judgment in our selection of competing goods and services based on our best knowledge at the time. It is all about individuals freely exercising their property rights to earned income which is protected by the US Constitution. The pace at which we do this advances or retards our economic activity. A good measure of our spending pace is the trend in Real Retail and Food Service Sales.
We have a long history of Federal Reserve actions and its impact on rates. While many believe the Fed controls rates, history has never supported this belief. The current fascination with Fed control of rates and control of the economy makes our current environment even more interesting and history that much more important. If one reviews the history of credit spreads and correlates this to Fed action, one finds that historically the Fed has mostly followed rate rises and declines (not shown here) by keeping the Fed Funds Rate higher than the T-Bill enough to discourage lending institutions which had gotten into trouble from seeking Fed help. The Fed would rather have market forces absorb troubled lenders. Chairman Volcker kept Fed Funds 100bps (1.00%) higher while Chairman Greenspan let this drift down to 40bps spread. Volcker and Greenspan were viewed and behaved more as Free Market bankers letting the demand for capital, economic activity and markets set rates. The Fed, on their watch, followed. The Fed has changed with the current administration. The current Fed seems to believe that it actually has control and should control the pace of economic activity. This is a Keynesian perspective of government and economic activity. The market has come in recent years to accept the Fed’s view of itself. This is simply wrong. The data does not support this thinking. The Free Market remains alive and well and I expect it dominate markets long-term.
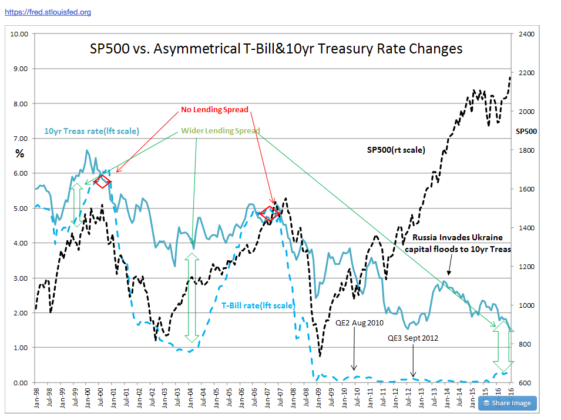
Three charts provide insight to this perspective. The SP500 vs. Asymmetrical T-Bill&10yr Treasury Rate Changes shows the correlation between the changes in the T-Bill and 10yr Treasury rates and the SP500. This chart is important to investors. When market forces cause investors to leave the safety of T-Bills for returns elsewhere, T-Bills rise. That we see this during economic expansions as the SP500 is rising should come as no surprise. The much higher returns in rising stock markets have always proved to be a strong allure to all investors historically. Eventually, capital set-aside for other purposes, is drawn into equity and business investments if the rising trend persists long enough This is called “The Recency Effect”. “The Recency Effect’ is a psychological term describing the impact trends have on our belief that we expect future results to be the same. This is what dominates Momentum Investor activity. 3yrs-4yrs of rising economy coupled with 3yrs-4yrs of sharply rising equity prices has always proved too much of a temptation. Such trends have always caused investors to abandon T-Bills for other investments. The net effect of such activity has always caused T-Bill rates to rise to the level of the 10yr Treasury rate. Once T-Bill and 10yr Treasury rates equalize, lending profits nearly disappear which slows lending activity rapidly. The SP500 peaks with a peak in economic momentum.
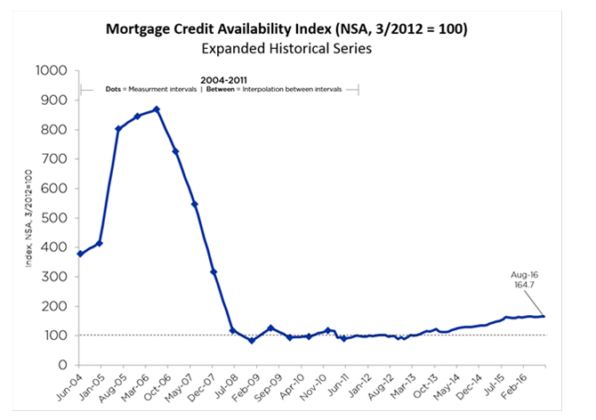
The impact 0.0% credit spreads have on lending is shown dramatically in a relatively new index called the Mortgage Credit Availability Index(MCAI-first introduced in 2012). By mid-2006 credit spreads had gone to 0.0%. The rapid expansion of Sub-Prime lending simply stopped and a market correction ensued. One can see this clearly in the SP500. The SP500 peaked for the same reason in 2000.
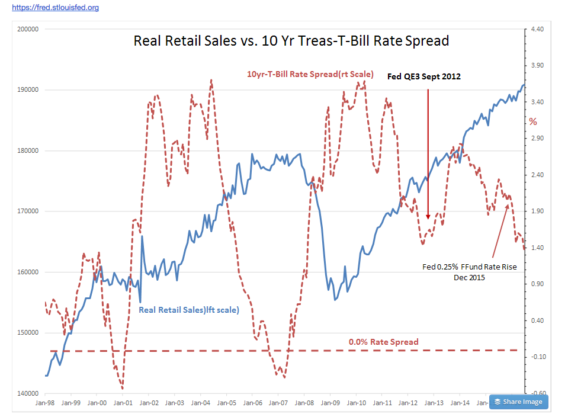
There is a longer economic record in the chart Real Retail Sales vs. 10 Yr Treas-T-Bill Rate Spread. Real Retail and Food Service Sales are correlated with the 10yr-T-Bill Rate Spread. It is relatively clear that this credit spread not only hits 0.0% but falls into negative territory as T-Bill holders in their frenzy for returns cause the short-term rates to exceed long-term rates in a condition professionals call an “Inverted Yield Curve”. The impact of 0.0% credit spread is across the entire economy, but it hits banks particularly hard because they have been responsible for most of the mortgage lending which drives economic activity during periods of economic expansion. Historically there has been strong correlation between housing and retail sales which remains in force today.
In our current credit/economic cycle the current crop of Fed officials have spoken often of their ability to control economic activity and they speak of their success in stimulating the current economic recovery. If one studies Fed actions vs. credit spreads, history does not support anything other than the Fed as being a follower not a leader. (Not shown here) There is evidence for this in Real Retail Sales vs. 10 Yr Treas-T-Bill Rate Spread. When the Fed initiated Operation Twist or QE3, it bought 10yr debt using issuance of T-Bills in an effort to lower mortgage rates with the goal of stimulating the US housing sector. Initially 10yr rates rose while there was no discernible impact on T-Bill rates. One can see that the strong rise in the SP500 at the time was correlated with a rise in Real Retail and Food Service Sales caused some investors to swap fixed income for equities in a bid for higher returns. In Jan 2014, Russia invaded Ukraine and a flood of capital entered US markets seeking safety driving 10yr rates lower. Market forces are at all times greater than the actions of central bankers. A high level of bank regulation is clearly slowing lending as can be seen in the MCAI which remains at less than half the level of past periods of normal lending(MCAI of 300-400).
The Fed’s recent desire to raise short-term rates and the market’s urging that somehow this will prove to be an economical stimulus does not make common sense nor is it supported by the recent economic data we have available. The proof comes in the Fed’s 25bps Fed Funds rise in Dec 2015. That particular rate rise caused the credit spread to narrow sharply. The Fed 25bps rate rise which impacted short-term rates caused some investors to fear the onset of an economic correction. The credit spread fell by nearly 100bps in response to the Fed’s 25bps increase, i.e. T-Bill rates rose while 10yr rates fell. This had both an anticipated and an after-the-fact impact on the MCAI which suddenly went nearly flat. Lending comes from multiple sources beyond banks and insurance companies. Businesses have multiple levels of lenders offering capital. Bank lending however has felt the brunt of Fed policy and Dodd-Frank regulation which in turn has been felt by a housing sector operating at about half the historical pace. Current residential property lending is at a $700Bill annual pace or about half what we could expect without current regulatory and lending climate. https://fred.stlouisfed.org/series/PRFI
Summary:
The economy can be read like a novel being written in real time. Free Markets are about individuals exercising individual property rights to earned income. Government agencies can exert influence short-term, but long-term economic activity is driven by individuals seeking to improve their standard of living. This is a global phenomena. Credit spreads reflect this. Credit spreads can be used as a proxy for future economic activity.
The positive credit spread today indicates we should continue to see economic expansion. The Fed’s action and commentary shows that this Fed is Keynesian and differs sharply from the Free Market Fed of past cycles. The Fed’s concept of credit easing through low 10yr rates is contradicted by the historical perspective provided by credit spreads. This Fed is receiving considerable pushback by some investors concerning its QE actions. Especially injured has been returns in defined pensions and endowments with long-term rates so low. Many blame the Fed and global Central Bankers. Certainly institutional investors are calling for the release of Central Banker assets as they are experiencing illiquidity in fixed income markets as a result. Should the Fed continue to raise the Fed Funds rate it is likely to receive even greater pushback. This Fed’s behavior shows that they do respond to markets if the market response is strong enough. Keynesians often change their minds to adjust to market pushback.
The Free Market should eventually force 10yr rates higher in spite of Fed and Central Banker actions. Wicksell’s Natural Rate suggests 10yr Treasury rates should be ~5%. It has been demonstrated many times in the past and recent evidence continues to support the expectation that Free Markets are stronger than the strongest Central Banker, including the US Fed. Real Retail and Food Service Sales show us that economic expansion continues and 10yr-T-Bill Rate Spread remains positive. There are imbalances with long-term lending rates at 5,000yr lows ( http://www.marketwatch.com/5000yr Low Rates ) and the US$ 30% in excess of its long-term trend, but these will normalize. On normalization, investors can expect volatility, but also expect higher equity prices.


