We’ve been saying this here for the last 4 years as markets have continued to climb higher….
“Davidson” submits:
Markets are not overly priced
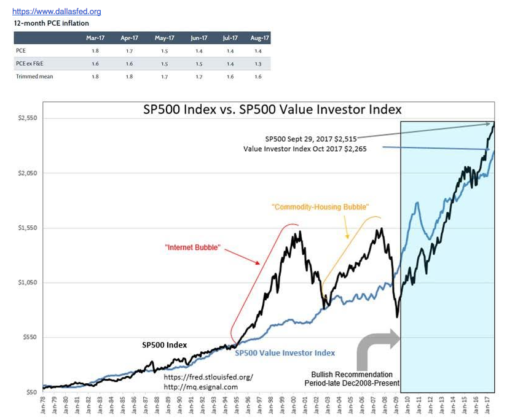
We routinely dismiss ideas of the past deeming them not relevant to today’s modern world. We argue that past observers never had the information we have available. Today’s information is literally at our fingertips. While that perspective is mostly justified, there are diamonds-in-the-rough who remain as relevant (perhaps more so) especially in financial markets which tend to remain very much a mystery to most. One of the most important is Knut Wicksell’s 1898 concept of the “Natural Rate” for which he certainly did not have economic data available that we have today. The SP500 Value Investor Index is based on Wicksell’s work and it is very useful.
The “Natural Rate” equals the long term real return of an economy smoothed across multiple economic cycles plus the best measure of inflation. This becomes the capitalization rate for long term cash-on-cash return expectations. When applied to the SP500 using its long-term earnings trend, one gets the SP500 Value Investor Index which is a proxy for identifying periods when the SP500 is relatively cheap for Value Investors. During recessions, when the SP500 swings below its Value Investor Index, it represents an attractive buying opportunity. When the SP500 exceeds the SP500, the market on average is much less of a buying opportunity, but because any market has many individual members, one often can identify some which are very expensive vs. some which are very cheap. Representative examples today for expensive are Tesla and Facebook while Exxon Mobil and commodity related issues are deemed cheap within the context of the economic cycle.
The Dallas Fed which calculates the 12mo Trimmed Mean PCE inflation measure just reported Aug 2017 at 1.62%, down from 1.94% in Jan 2017. Falling inflation boosts the value of returns and justifies a higher pricing of the SP500. The SP500 is priced at $2,515 vs. the SP500 Value Investor Index at $2,265 or a 12% premium. Based on past speculative premiums during recent market peaks in the 60%-100% range, the current premium of 12% reflects a relatively low level of speculation. This matches the recent observation of a rising T-Bill/10yr Treasury rate spread which indicates higher equity prices for the next 2yrs-3yrs.
The “Natural Rate” today is 4.58%. The fair rate for the 10yr Treasury based on this is ~5%. The current 2.33% 10yr Treasury level represents a “Bubble” in my opinion and a high level of investment risk. Fixed Income with long maturities is something to be avoided in my opinion.
The “not-so Mystery’ behind low Inflation
Recent commentary by the Fed refers to falling inflation as a “Mystery”. https://www.bloomberg.com/news/articles/2017-09-20/yellen-brushes-aside-inflation-mystery-as-fed-eyes-rate-hike
Again, we prefer modern interpretations and ignore a long history on which one can rely to understand the source of inflation. It is a long history indeed. Aristophanes(446BC-386BC) wrote about currency debasement in “The Frogs”, Nicole Oresme(1320-1382) in his treatise “On the Origin, Nature, Law, and Alterations of Money”, Nicholas Copernicus(1473-1543) stated Copernicus’s Law, “bad money drives out good” and this was repeated in 1860 as “Gresham’s Law”. Currency is added and taken away from the financial system in the normal course of business expansion through a fractional-lending based financial system. Successful businesses which add to society’s standard of living increase currency and the value backing it while businesses which fail result in a decrease of currency. Think of net currency increases as coupled to increases in shareholder equity and debt which is current or an expansion of society’s overall financial structure. Failed company equity or debt are written-off, reduced to zero value. Write-offs reduce the currency and the overall financial structure. Currency is tied intimately to the productive addition of value to society’s standard of living. Corporate profits are a measure of currency expansion. Corporate losses measure currency reduction. When governments spend, there is some added societal benefit depending if it can perform a function more cheaply than society can as a whole. Creating and enforcing rules of commerce or building avenues of commerce such as highways and bridges are things better handled by government than businesses if handled efficiently. Inflation occurs when government spends without adding value to society and this is the same as currency debasement. This is especially so when government expands the currency base by the issuance of debt and spends the money without a return to pay back the borrowed funds.
Currency created without returns to society debases existing currency. It is inflationary.
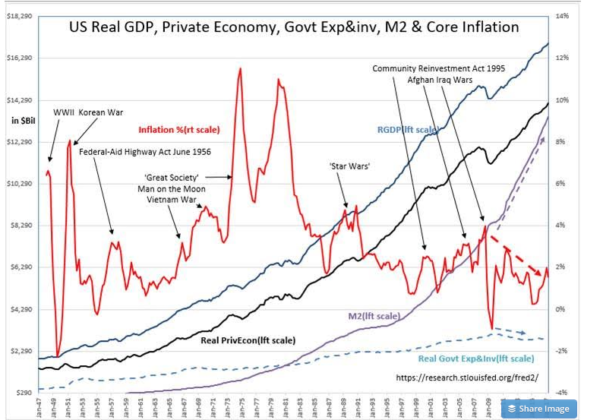
History has many examples noted as inflationary spikes during periods of government spending. Government spending has always been known as inefficient, costly and even has been recognized as egregious political rewards to select political benefactors. The US history from 1947 has many instances of low-value government sponsored projects which were followed by significant inflationary spikes. Today’s Fed has coupled expansion of M2(Money Supply) to historical inflation and guaranteed that they could ‘juice inflation’ and bring the US economy out of the 2009 Great Recession easily by simply bosting M2. Instead, the Fed is mystified by Inflation falling steadily as M2 soared through multiple Quantative Easing actions as the record shows. What did the Fed miss?
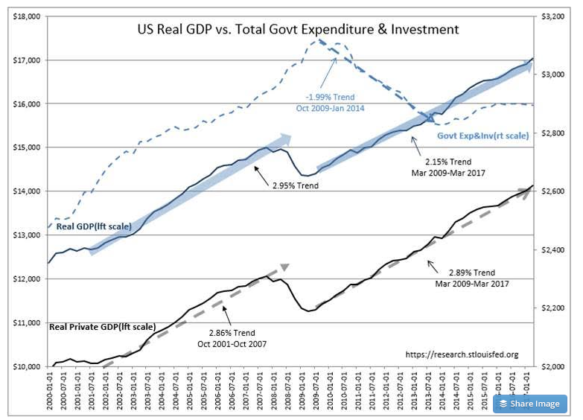
The answer to low inflation is to be found in what has occurred in Real Government Expenditure & Investment. From Oct 2009-Jan 2014, Real Government Expenditure & Investment fell sharply. This was followed by a small rise Jan 2014-Jan 2016 which then went flat and is now threatening to fall yet again with the recent report. Inflation mirrors government spending with a lag as it has since 1947. The Fed can raise M2all it wants, but if the money is not spent on wasteful government programs, there will be little impact on Inflation.
This is the first time it has been this clear in the economic data that Aristophanes’, Nicole Oresme’s and Nicholas Copernicus’s observations framed as “bad money drives out good” has proof of the concept as it pertains to the impact of government spending.
There is no ‘Inflation Mystery’. Government spending just declined!
Surprise, surprise-signs of economic acceleration
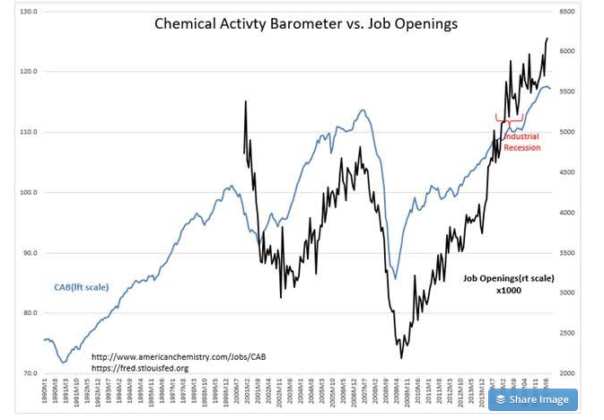
In addition, this economic data reveals the ‘mystery’ of the slow economy not matching the record levels of employment, record levels of Real Personal Income, Real Retail Sales and etc. Except for US Industrials which are just exiting a recession brought on by the strong US$ 2014-2016, most US companies are seeing record net income. The bulk of the data has simply not matched the reported dismal pace of Real GDP. For many, this has been highly confusing and resulted in many postponing investment decisions. The unraveling of this mystery lies with Real Government Expenditure & Investment.
Real Government Expenditure & Investment is part of Real GDP. To understand what the productive portion of the US economy is doing one needs to subtract out government spending. When this is done, we are left with the Real Private GDP. Suddenly it becomes clear that the fall in government spending has masked the underlying strength of the private economy. The strength of the Real Private GDP has been in line with the historical trend since 1947. Not only is this cycles much maligned US Productivity on par with the historical trend, but so are Hourly Wage gains when viewed corrected for inflation.
Now for one of the greatest surprises of all. The latest revision to Real Private GDP just raised the entire trend from March 2009-March 2017 from 2.82% annually to 2.89%. The US economy appears to be indeed accelerating as we exit the 2014-2016 industrial recession due to US$ strength. The Chemical Activity Barometer(CAB) and Job Opening reports support this assessment. As the US$ continues to normalize, Real Private GDP should accelerate, all other things being constant. As economic activity continues to accelerate, we are likely to experience substantially higher equity markets.


