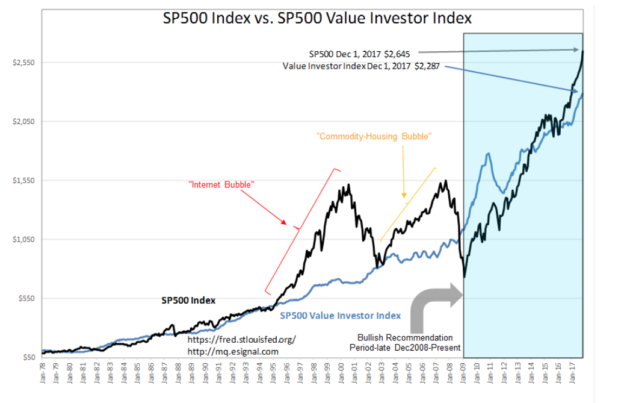
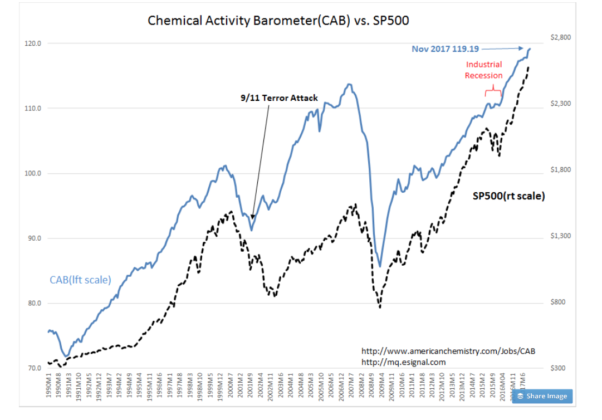
This indicator, taken with the CAB has been perfection since “Davidson” first introduced us to the Index in early 2009. Regarding today’s warning by Goldman “Davidson says”
So many misperceptions on valuation analysis, where could one possibly begin? I see the Shiller C.A.P.E. P/E as part of the mix which is what is likely driving the analysis to find other measures. No one uses fundamentals even though they all claim they are ‘experts and know ‘valuation’. It is what it is.
The 2000 SP500 peak over-valuation of equities ran to 130% of the Value Investor Index. With so much inexperienced capital in US fixed income from China and other foreign sources, my guess is that SP500 could achieve a new level of over-valuation once they decide to all become Momentum investors. Bitcoin’s madness is due to foreign investors seeking to get capital to US and other Western nations and out from Chinese Russian, Iranian, Turkish autocrats.
My guess that SP500 could reach $4,000+ may prove conservative. Take the Value Investor Index, advance it 4yrs at 6.1% and you get $2,898. Now, calculate an SP500 at 130% premium and you get $6,665. Could happen. Time will tell.
“Davidson” submits:
The Dallas Fed reported its inflation measure, the 12mo Trimmed Mean PCE, at 1.60%. Inflation has fallen steadily from 1.94% reported in Jan 2017. Falling inflation is the result of a slower pace of discretionary government spending as noted in my earlier commentary on the differences in Real GDP vs. Real Private GDP. The lower the inflation the more valuable earnings become. Investors bolstered market prices in 2000 on the belief that Internet companies would nearly eliminate inflation and the SP500 saw a P/E over 35 briefly. The SP500 Value Investor Index was priced less than 50% of the SP500 levels(SP500 priced more than 100% of the Value Investor Index).
Today the SP500 is only priced a modest 15% higher than the SP500 Value Investor Index and facing an acceleration of global economic activity. Decently higher corporate earnings remain ahead in my opinion based on labor demand indicators and rising Chemical Activity Barometer(CAB).
There is no means of predicting how ‘high’ and ‘when’ economic activity and investment markets will top-out. The two most useful indicators remain the CAB and the T-Bill/10yr Treasury rate spread. These are reasonably good at giving 18mos+/- warnings to an economic correction.

