“Davidson” submits:
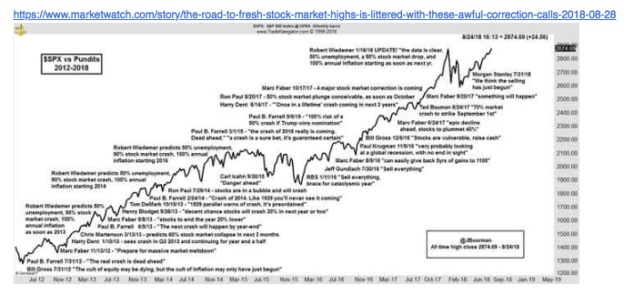
Making investment decisions requires monitoring and working through a massive flow of current opinion comparing diverse forecasts with market prices in the context of economic and specific corporate financial trends. That was a mouthful and indeed is the reality of what one needs to do. Net/net, conditions remain as positive as they have been since 2009 even though valuations are no longer steeply discounted. I call your attention to Jon Boorman’s recently published chart, Aug 28, 2018, which is instructive in comparing pundit forecasts to market performance. Jon is a technical analyst* and portfolio manager for Broadsword Capital. One must continuously look through to fundamental economic and corporate trends before making key investment decisions. Doing so has revealed a positive investment context since 2009. Nothing has changed.
*Technical Analysis is based on the belief that ‘The trend is your friend’ and predicts the future. I do not recommend or use this approach.
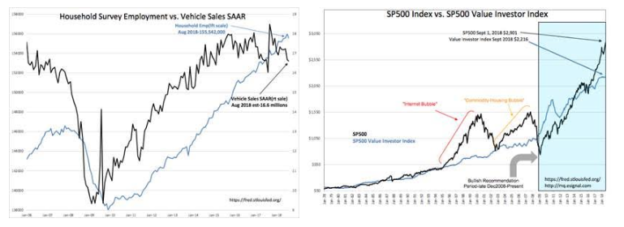
Conditions remain for significantly higher equity prices. The Household Employment report was 469,000 lower than last month’s report, but remains solidly in the trend since 2009 and economic expansion. Light Weight Vehicle sales estimated Aug 2018 SAAR(Seasonally Adjusted Annual Rate) of 16.6mil also remains in a range consistent with continued economic expansion. Yes, SP500 valuations have risen due to the impact from the highly over-valued FANG issues entering the index, but looking at the R3000, it is relatively simple to identify many high quality under-valued issues. For this reason the SP500 Value Investor Index is not helpful with market tops but only at recession lows.
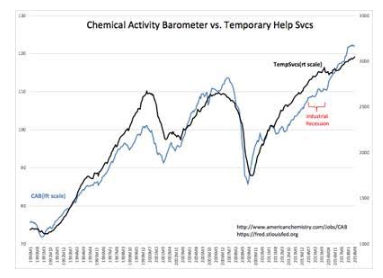
Temporary Help Services just hit an all time high which portends higher levels in Household Employment are ahead.
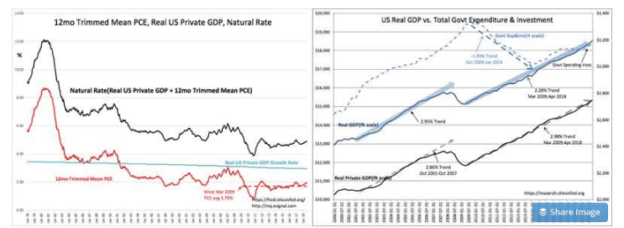
Some worry about inflation and believe portfolios should be shifted accordingly towards commodities. The facts behind inflation reveal it to be tied to periods of excessive Government Expenditure & Investment. We have just exited an 8yr period of a reduction in government spending and flat inflation. The 12mo Trimmed Mean PCE, produced by the Dallas Fed, of 1.94% sits only a little above the 1.7% avg since 2009. Yes, government spending under the current administration has risen a little, but it is not clear that this is inflationary. Real government spending as a percentage of US Real GDP is the lowest at 17.2% it has been since 1947. Whatever the government does today will have far less impact than any previous period. Even if this spending has some inflationary impact not only is it likely to be muted but commodities are not the preferred counter balance. The best investments to counter inflation have always been well run companies which pass inflationary price shifts to customers for whom their wares are the most competitively priced. The better companies practice ‘Lean Processes’ as imbedded the styles of Danaher Business System and the Toyota Business System.(Neither of these issues are current recommendations due to over-valuation, but there are many other attractive situations)
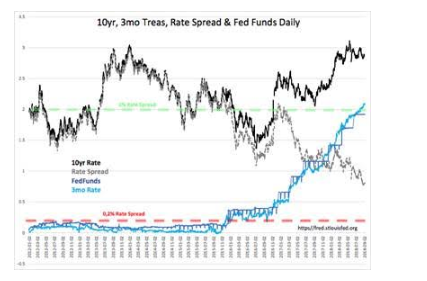
If there is one indicator above all others which has been tested over many decades, it remains the T-Bill/10yr Treasury rate spread. This rate spread is a good proxy for lending by financial institutions. The level which results in lending activity expanding economic activity is anything above 0.2%. Historically the range has been 2%-0.2%. The current level of 0.8% is mid-range and remains decently positive for continued economic expansion. Few market forecasters seem aware of this indicator.
We live with a 100yr+ misperception in our historical approaches to investment analysis. Namely, everyone has sought a mathematical solution imbedded in the voluminous flow of numbers produced by investment activity. The first recognized so-called ‘mathematical solution’ to investment markets was by Louis Jean-Baptiste Alphonse Bachelier, a French mathematician, in 1900. The effort has intensified ever since with an explosion of work after Markowitz’s Modern Portfolio Theory(MPT), 1952. Financial Planning which has permeated all corners of investing today is derived from MPT and drives future expectations based on past events using algorithms which has raised investor confidence that they have tamed markets. Nothing can be so misguided than the belief that one has “tamed markets”.
Nothing can be so misguided than the belief that one has “tamed markets”.
Just as human society has continuously advanced and never repeated the past, investment markets do not repeat the past. The situation today in relying on MPT to invest for the future has permeated all corners of investment activity. This is a formula for a significant market correction during the next economic correction. All will have been bullish at just the wrong time due to MPT. The better approach, in my opinion, is to identify those indicators which reflect investment behavior and cycles and use one’s experience and judgement counter to consensus opinion. Market prices are set by consensus opinion. The better investments are identified using a combination of economic and corporate financial trends and contrary to market psychology. In other words, buy high quality management teams when other investors are pessimistic and prices are low.
The Investment Thesis:
In my opinion, the better approach to investing comes from understanding how to identify the better management teams and how to buy their company shares at low prices. Do this across a 50+ issue portfolio and one will never buy at the top and always be fully diversified. One will at all times have input from an impressive group of corporate managers closest to real-time economic trends. One will always have a good long-term perspective of market potential.
Currently, many good ideas remain available and economic expansion highly likely to continue.
