“Davidson” submits:
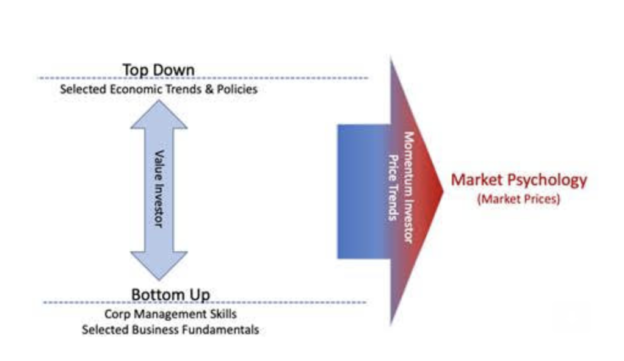
Market prices are set by market psychology. Prices are investor anticipation of future financial trends which they believe other investors will come to recognize and drive prices which benefit those who are early to the trends. It is a complex mix of investor perspectives. Investors simplistically fall into two style buckets with one bucket representing Value Investors and the other Momentum Investors. The Value Investor assesses economic, business and government policy fundamentals to guide decisions which they believe are likely to be profitable over several years. The Momentum Investor is a trader often using margin, computer-guided algorithms taking short-term positions on cues from price-trends. The illustration schematically contrasts Value Investors as early decision makers using long-term fundamental economic trends to anticipate reports which they expect will influence other investors’ decisions. Most investors wait till financial reports establish a trend which is obvious. One observes market prices routinely reset in response to reported outcomes, i.e. after the fact. Momentum Investors wait till enough investor psychology has shifted that a price-trend is more obvious and then essentially ride-the-trend much like surfer on a wave. Their goal is to capture the trend early and exit before the trend turns against them. To be a Value Investor one needs to build knowledge gaining experience and judgement over years of detailed analysis and anticipate economic/fundamental outcomes before they become headlines. Value Investors with their long-term perspective create the major cycle lows which occur during recessions. Momentum Investors following price-trends and being insensitive to valuations, create major cycle peaks and rapid selloffs whenever news is worse than expected. To be a full-cycle investor, one needs to understand both Value and Momentum Investor thinking.
Economic/business Fundamentals and government policy drive economic trends…
…which in turn drive reported outcomes…
…which in turn drive headlines…
…which in turn drives market prices.
Market outcomes have limited visibility. Most investors rely on proxies for insight. For decades copper prices, “Dr. Copper”, were believed to provide quick and simple insight on which to make investment decisions. More recently many have turned to oil prices. Recent correlations and market commentary indicate oil prices are part of many algorithms and a significant economic forecasting tool.
https://www.investopedia.com/terms/d/doctor-copper.asp
“The term Doctor Copper is market lingo for the base metal that is reputed to have a Ph.D. in economics because of its ability to predict turning points in the global economy.”
https://www.investopedia.com/oil-4689767
“Oil is often referred to as the lifeblood of an economy. It’s a fossil fuel commodity that is highly attuned to even the slightest changes in supply and demand.”
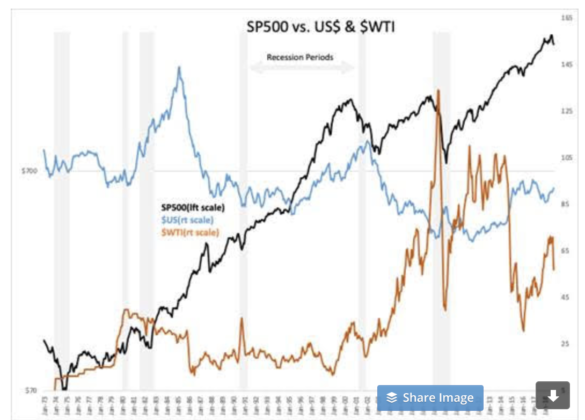
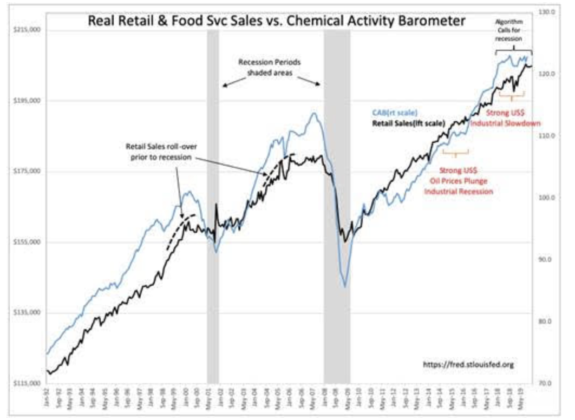
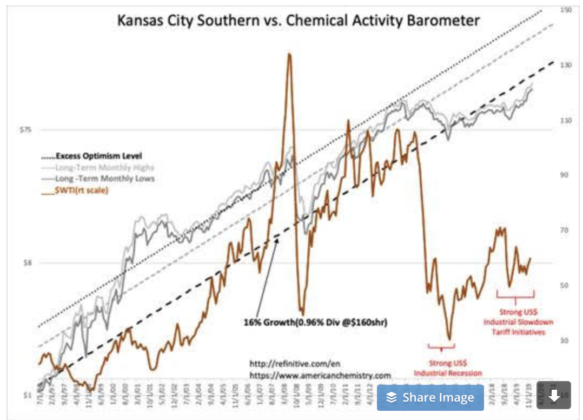
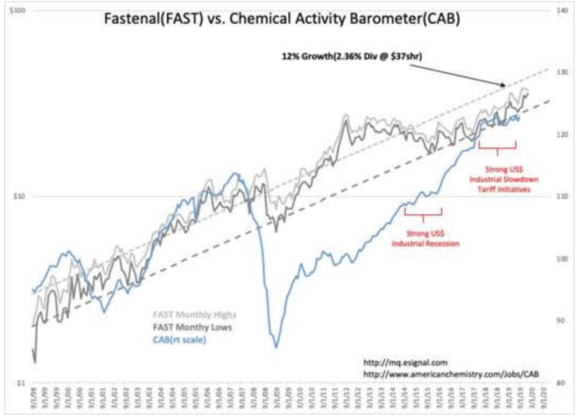
In actuality, commodity prices tend to follow economic trends not predict them. Oil in particular soared on the belief the world was running out of this crucial asset only a few years ago. “Peak Oil” fears drove $WTI(West Texas Intermediate Oil Prices) to $145.31 July 3, 2007 only to see prices plummet to $34.03 on Feb 12, 2009 as investor shifted their perceptions of economic activity and inflation. As the economy recovered after the “Sub-Prime Housing Bubble”, $WTI rose to $113.39 Apr 29, 2011, again on oil shortage fears vs economic demand only to plunge once again after Russia invaded Ukraine in 2014. This time the overwhelming influence was a combination of speculator activity tied to US$(US Dollar). The US$ soared by more than 25% as global investors panicked. The trading algorithms (which had not been as prevalent in 2007 as they are today) had correlated oil inversely to the US$ and the perception of economic activity. Plunging oil prices slashed Cash Flows for energy related issues. The Chemical Activity Barometer(CAB) recorded a slowdown in industrial activity. Retail Sales, a general indicator of US economic activity, did not stumble. Algorithms keying on proxies provided incorrect forecasts and market fears were overblown. The perception of $WTI as an economic proxy is misplaced. The trend of Production/Consumption since 2011 has been, even with extreme price swings, quite stable at 1.74% annual growth with +/- 0.013%. Restated: oil prices display no correlation with consumption or production. Oil price is a very poor economic forecasting tool as was “Dr. Copper”.
In the face of falling $WTI, the lack of recessionary signals from important economic indicators has not prevented investors from believing the next recession was imminent. A relatively high level of fear has been present since Russia’s 2014 invasion of Ukraine, Year-end 2018 the media declared of the onset of another “1929”. Since then, we have experienced multiple panics even as economic activity continued to register record employment, record retail sales and recoed personal income. The better economic/market indicators turn out to be economically centrally placed companies with with excellent management teams. In this note, Kansas City Southern(KSU) and Fastenal(FAST) are highlighted.
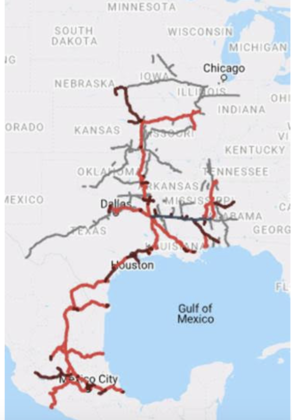
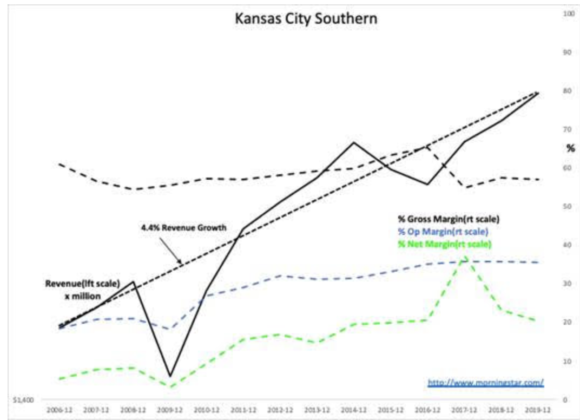
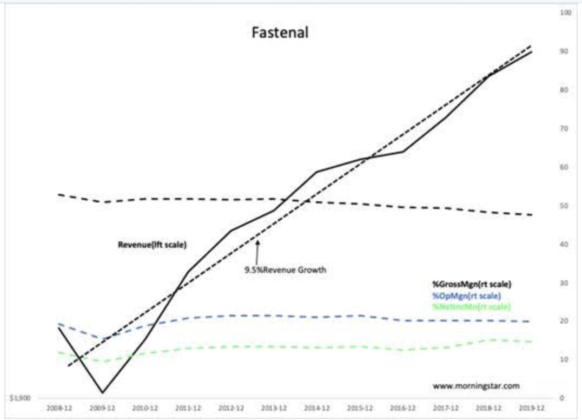
KSU and FAST are two companies highly qualified to represent US economic activity. Both serve a broad swath of industries at the heart of US GDP. KSU serves a customer base from Chicago into northeastern and central Mexico and to the Gulf of Mexico ports of Tampico, Altamira and Veracruz, as well as to the Pacific Port of Lázaro Cárdenas. FAST is a logistics company, a consultant, a technology solutions provider and more generally, a distributor of wide-ranging industrial and construction products. FAST serves the US, Mexico, Canada and Europe. The long-term records of KSU and FAST management teams are legendary. Price histories and Morningstar financials underline their long-term success.
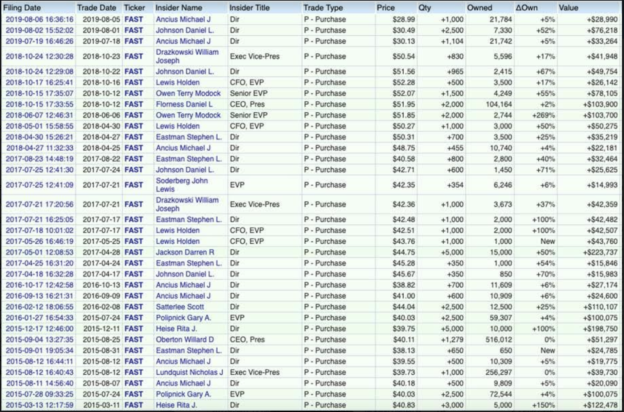
Using KSU and FAST as economic indicators relies on paying close attention to management commentary, financial outcomes and insider buying activity in conjunction with multiple economic indicators such as the CAB, Retail Sales, Trucking Tonnage Index, various employment and construction indicators, trends in the US$ and US and trading partner policies. KSU and FAST provide great economic insight precisely because their management teams have a history of successful and insightful decision making. By paying close attention to what these managements forecast, the nature of their acquisitions and their insider buying behavior in the context of the broader economic context makes KSU and FAST (and other well-managed companies in other sectors) far better economic indicators than those commonaly employed. KSU and FAST management commentary provide realtime economic insight that proxies cannot. The recent insider buying of each is provided. KSU and FAST recently reported 4Q19 Revenue and EPS at record levels and forecasted additional gains for 2020.
In deciding the direciton of equity markets and whether investors have overblown pessimism or optimism comes from combining historical pricing of companies like KSU and FAST with the trends of their Revenue, Gross-Operating-Net Income Margins, the historical pricing of Revenue, i.e. Pr/Sales ratio(and other metrics) with the long-term record of share prices, the level of activity of management share accumulation and management’s expectations. In today’s market, these signals standout as quite positive in the face investor pessimism. Numerous well managed companies are currently valued at 10yr low Pr/Sales metrics. Should invstors return to KSU and FAST and reprice shares in line with their business fundamentals of even 5yrs ago, share prices would be substantially higher than present. These issues not only provide good measures of economic activity by watching their economic performnce but their share prices are decent measures of investor enthisiasm and overall over-pricing in the general market.
“Drs. KSU & FAST”, whose businesses continue at record levels, remain significantly below where investors have priced them only a few years ago. Many industrial companies with excellent fundamentals have similar underpricing. The SP500 has been making new highs as Momentum Investors pile capital into 5 issues such as TSLA, AAPl, Netflix and select others while ignoring the remaining issues in the chase for performance. The SP500 appears overvalued simply because Momentum Investors have forced higher prices of those issues with already excessively high valuations. The discussion today that the market is much like the “Internet Bubble” is based on 5 hot issues of the day and ignores the other 98%+ rest of the market . As US policies continue to favor additional expansion, earnings reports yet to come should cause investors to favor those companies which investors have ignored. Fear of the long awated recession should ease.
As the many companies currently under-priced in today’s pessimistic environment regain investor interest, we should see equity prices rise. Using the undervaluation of KSU and FAST to their own historical valuation trends, the expected price rise may prove substantially higher than what we have today.
